http://stockcharts.com/h-sc/ui?s=$SPX&p=D&yr=0&mn=6&dy=0&id=p83257770514&a=266398464
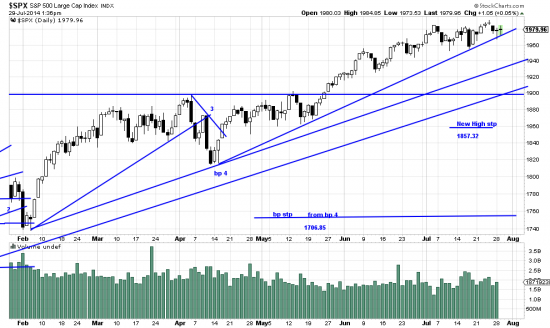
The top trendline here appears to be vulnerable to being broken. This will inevitably cause some commotion — how much unknown, but some. The next trendline down is the worrisome one — from nov12. Nontheless this present short term trendline should be looked to. Readers have probably forgotten that occasional downwaves occur. They should now look to their portfolios and plan a strategy if the downwave develops. We will have some suggestions in the next few days.
Readers know that we take special glee in mocking the mutual fund industry. Well why not when it’s such a fat and deserving target — deserving beause self-serving. Here is a link to a New york Times article which documents the competence (in-) of the business. S&P, that pristine organization known for rating subprime mortgages A+, studied 2,862 mutual funds over a period of five years to see which (if any) managed to beat their competitors year to year over a five year period (sort of like the tiny pigs race at the county fair). They did manage to find some funds which had consistently outperformed the business. Two. TWO. 2. Dos. Due.


Hi Charles,
I have expected a correction of some magnitude for some time: divergence, small/ large, season, volume…Curious as to what tipped the scale for you?
Best,
Harry
the proximity of the april trendline. The only way it can avoid being broken is to rocket up at this point.
charles