http://stockcharts.com/h-sc/ui?s=$SPX&p=D&yr=0&mn=6&dy=0&id=p83257770514&a=266398464
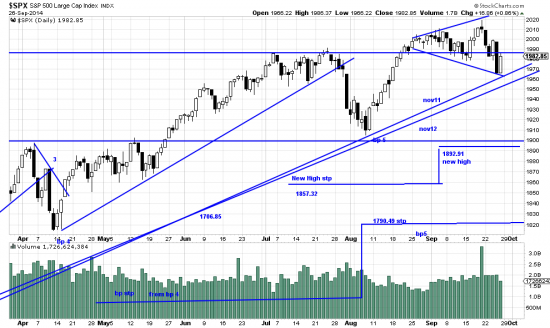
The little downwave (or downwavelet) of early September puzzled us somewhat as we took it at first as an a-b-g-z (or a-b-c in Elliott speak) formation. But then the b wave took off and we thought that was the end of that. Well maybe it wasn’t. The lurching downwave of the last six days might be the c (g) wave we looked for. The heightened volatility over this time is discomfiting and may lead to worse price erosion. Of course, to keep the context in perspective, we are barely 2% off a record high.
But this volatility is occurring in the context of what appears a broadening formation, as illustrated by the megaphone lines. These formations are usually reversal patterns, but we have already seen at least one in this market which failed to reverse. Of greater importance is the propinquity of the nov12 trendline–about 1% away. This acts first of all as support, but if decisively penetrated is ominous– if not an early bear market warning. We would be hedging if that occurred. At junctures such as this over the past few years we have repeatedly said that readers were best served by observing the computed and illustrated stops and grinning and bearing downwaves which were not trend changing. For amusement they can watch us squirm to avoid our fate — which is to lose money on the hedge.
Now let us examine sentiment — ours. We are genuinely concerned about a severe correction (10% m/l) here. If it occurs (and what is happening is occurrring) (don’t try to unravel that –it would probably explode) if it occurs it will just be the necessary cleansing of the unwashed and unworthy. Then we will get on with a new bulll market.


