http://stockcharts.com/h-sc/ui?s=OIL&p=D&yr=0&mn=9&dy=0&id=p41422967883&a=251242709
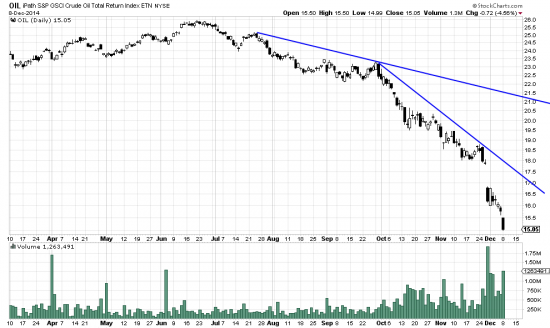
Short was what our long trade in Oil was. Now it’s not only short in time, but short in direction. The prominent gap at the end of the chart we took as an exhaustion gap, but now it seems that it was a continuation gap and today’s action confirms that. Only experienced readers should fool with this market — and then only when the lower trendline is broken.
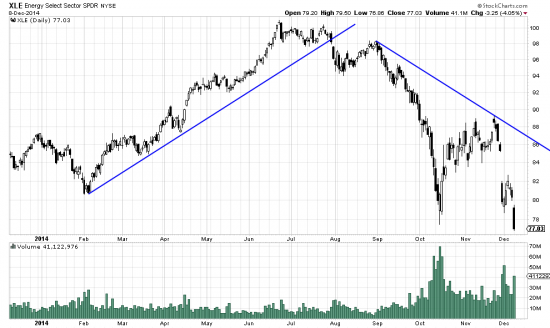
Of course the fall of oil has affected the sector ETF, XLE.
http://stockcharts.com/h-sc/ui?s=XLE&p=D&yr=1&mn=0&dy=0&id=p07522680205&a=379723635
You are probably long this sector without thinking about it — as part of the SPX. Now here is an example of a natural hedge. Short the XLE and its adverse effect on the SPX will be neutralized. ERY is a 3x short energy ETF as are REC and DUG. These are leveraged instruments, which is fun when the market moves in your direction and painful when it moves against you. etfchannel.com has a list of these instruments.


