http://stockcharts.com/h-sc/ui?s=$SPX&p=D&yr=0&mn=6&dy=0&id=p22775897357&a=266398464
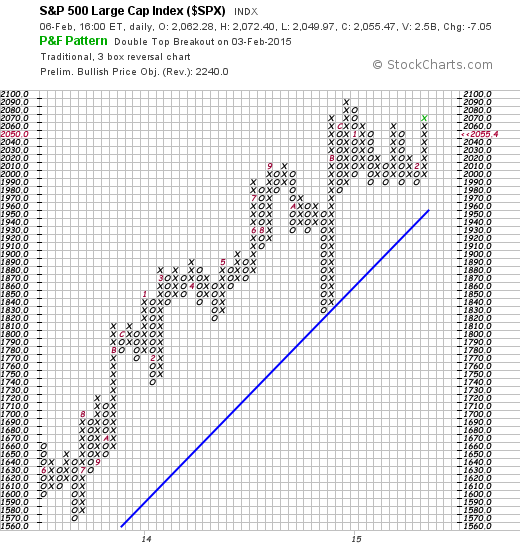
Is it imaginable that something constructive has occurred this last week? The PnF system, in fact, operating as always at a surgical removal and not caring for other systems identifies a breakout and computes a target of 2240.
(no link — see stockcharts .com)
We don’t disagree with this target. It is in fact close to the first target we identified with the rule of seven. And, as always, the time horizon for this target floats in space with no time attached to it.
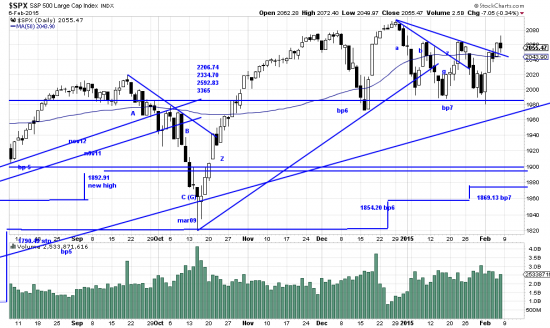
Looking at the top chart we can see that a new downsloping trendline (like that which originally crossed the z wave) was broken (also causing the PnF breakout). This is positive. Also a higher wave low (bp7) results in raising the long term stop to 1869.13. We have left the old new high stop intact. Also intact is our criterion that for the pattern to be favorably resolved we must make new highs. If this were a “normal” market we would say that the breaking of the latest trendline would be the occasion for adding on. An aggressive investor might do that. We’re waiting for a new high unless we see some major action here. At least we’re looking up instead of down, which is a welcome change.


