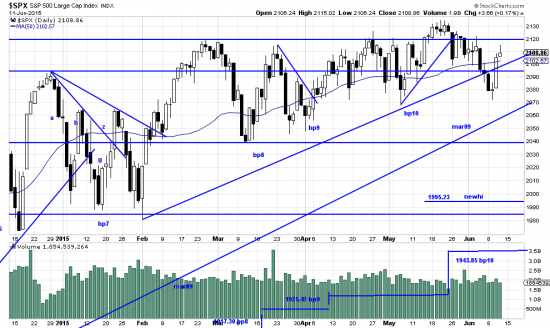
http://stockcharts.com/h-sc/ui?s=%24SPX&p=D&yr=0&mn=6&dy=0&id=p09524411098&a=266398464
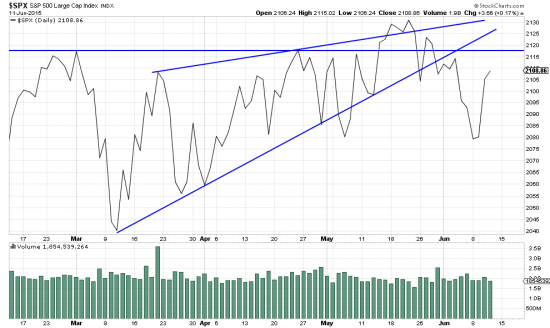
Return with us now to those thrilling days of yesteryear…when photos were developed in a darkroom in trays of chemicals. The present situation in the S&P is like that developing picture–slowly resolving itself. As it were, meandering to its end. It has been meandering in a wedge, which we see in the next chart. In this chart we see a broken trendline as well as seeing systems stops– and other trendlines, some going back to mar09. It is a characteristic of market tops to meander sideways but in the process they generally form patterns and characteristics which tip off the analyst as to their intentions. There is none of that here. BUT –should this be the dreaded Lalapaloosa top* we will be protected by stops set by the Magee procedure –illustrated here.
Yesterday the market did its variable interval of reinforcement thing. (Back in those thrilling days of yesteryear B.F. Skinner taught pigeons to peck a button for bird seed. Once they learned he put them on a variable interval of reinforcement. Meaning he would make them peck for five minutes to get a seed. Then peck 1 minute. Then 10 minutes, then 1–etc. etc. Finally he wanted to see how long the pigeon would peck without being rewarded. Several days, thousands of times, until the pigeon fell over dead.) Yesterday was interesting but just one point in the developing picture. We will not be able to put it into perspective until either the near high, or near low is taken out.
http://stockcharts.com/h-sc/ui?s=%24SPX&p=D&yr=0&mn=4&dy=0&id=p34003818356&a=407475521
Prices have broken down from the wedge, as expected. Prices are attempting to get back to the line, as is routine. The market is completely confused and at the mercy of the contrarians. We added to our short bond position but we don’t look to be doing any buying until the picture has developed.
*The stealth top pattern identified by Milton Friedman in 1928.


