http://stockcharts.com/h-sc/ui?s=%24SPX&p=D&yr=0&mn=3&dy=0&id=p76611673066&a=266398464
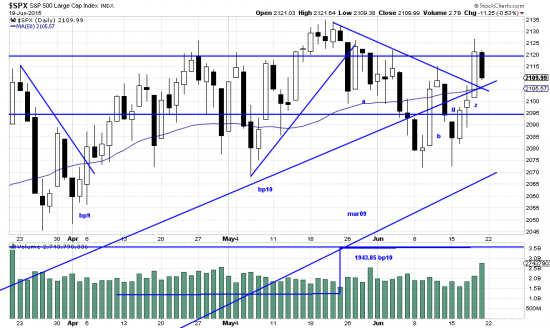
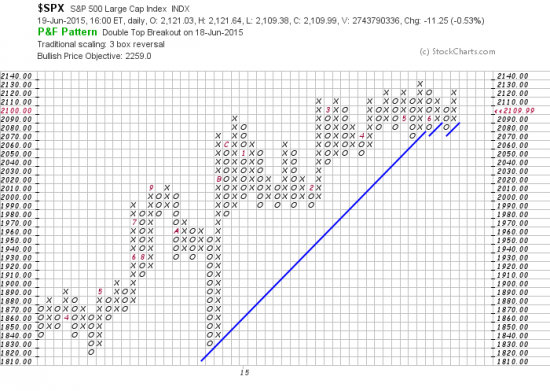
A promising zeta wave was interrupted Friday by contrarian selling. Not a very favorable omen, since next week is according to tradition a down week. But the situation is one of questions, not answers. The answers may be forthcoming next week. Of note, volume was notably heavy as the chart shows. These heavy volume days often mark the end of a wave. Various ominous questions hang over the market — a Greek implosion, a Chinese meltdown, and the market reaction to Donald Trump’s candidacy. If there is to be a rocky week ahead it will set the stage for the next wave up. As we look at in the following PnF chart.
http://stockcharts.com/freecharts/pnf.php?c=%24SPX,PWTADANRBO[PA][D][F1!3!!!2!20]
The method identifies a double top breakout with a target of 2259. We have previously pointed out the ambivalence of this chart — 5th and 6th bars from right representing bear and bull traps. So it remains to be seen whether the target is feasible. We think it’s quite possible and we also expect some nastiness next week.
Price proximity to the mar09 trendline is worrisome, as shown in the top chart. — Less than 3% away.


Sounds right to me. Feels like one last big move up that draws in anyone who is sitting on the side lines. I have heard from many friends lately that tell me they lost so much in the 08 bear that they sat out they sat out until now and asked me about getting back in as they cannot handle 0 interest rates.
Harry