http://stockcharts.com/h-sc/ui?s=%24SPX&p=D&yr=0&mn=3&dy=0&id=p76611673066&a=266398464
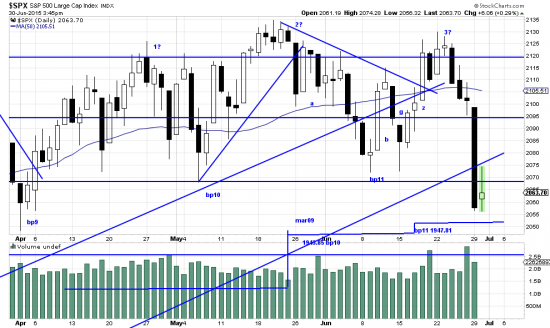
If you’re looking for trouble you might have found it. We will belabor the obvious by pointing out the negative aspects of this chart: Possible (maybe even probable) head and shoulders; Neckline penetration reacting to Greek tragedy; Penetration of mar09 trendline (!!).
http://stockcharts.com/h-sc/ui?s=%24SPX&p=D&yr=7&mn=0&dy=0&id=p29060750188&a=414449998
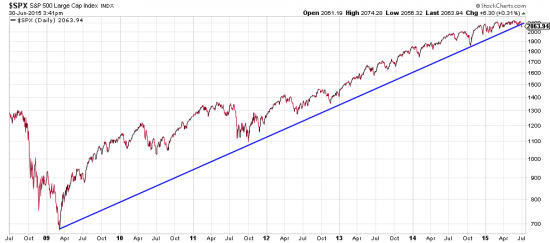
As we have said repeatedly bad things happen when long term trendlines are broken. The last time a trendline of this significance was broken Humpty Dumpty fell off the wall. And all the king’s horses and all the king’s men… Well, you were there you know what happened. We don’t see it so severe this time. And, of note, these penetrations are still to be confirmed. (Remember, Magee opined that a 3% penetration was necessary to confirm.
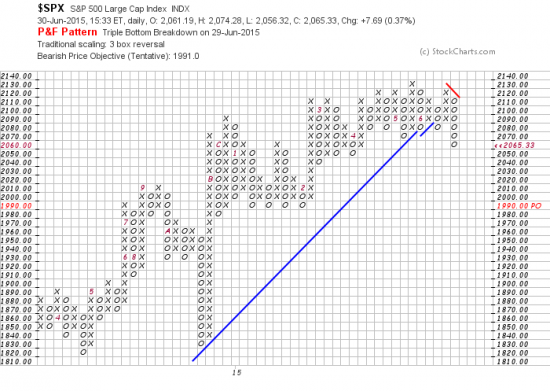
As far as the PnF system is concerned it sees a downside signal, targeting 1991.
http://stockcharts.com/freecharts/pnf.php?c=%24SPX,PWTADANRBO[PA][D][F1!3!!!2!20]
The top chart does not put the stop in proper perspective (because there wasn’t enough depth in the chart) but the system stops are annotated. As we have said investor choices are not attractive — hedge, sell, short or wait and see if the system stops hold. As we also have continuously emphasized no decision is set in concrete. You can always change your mind, unlike the Street which sits on losses. If this analysis is wrong the chart will tell us in good time. For ourselves we will be scaling into a short position. And at the moment some family accounts are observing the system stops, but this can change in a leap second.


