http://stockcharts.com/h-sc/ui?s=%24SPX&p=D&yr=0&mn=6&dy=0&id=p38955316076&a=266398464
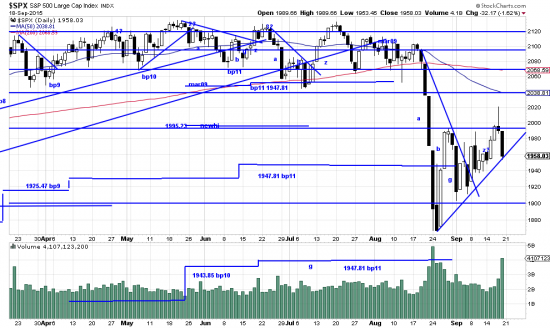
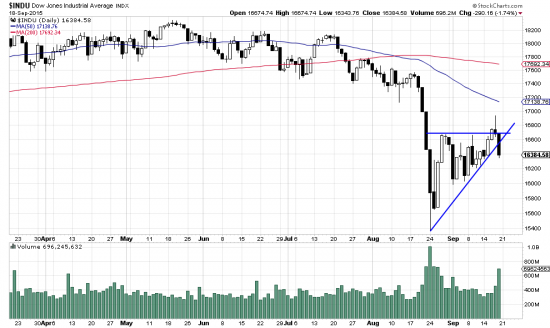
Occasionally we check in on Marketwatch.com, mostly for laughs. And laughs is mostly what it’s good for. But this week we became sensitive to the potential damage taking it seriously could do to the average investor. It’s primary function is as a source of market misinformation, chaos and confusion and a marketplace for pundits and psuedo analysts who are in a constant process of sowing fear and uncertainty to attract attention. Two things this week especially caught our attention. One, the misidentification of the formation in the Dow. The writer puffed up the pattern as a symmetrical triangle and misinterpreted it as a continuation pattern. If anything the pattern is similar to that of the SPX — an ascending triangle, which should be a reversal formation.
http://stockcharts.com/h-sc/ui?s=%24INDU&p=D&yr=0&mn=6&dy=0&id=p31650012639&a=424811737
In each case the present development is pessimistic. An abortive breakout to the upside is rejected and Friday the power bar is to the downside. The increased volume and the length of the bar augur downside action next week. Also the bar has broken out on the downside of the pattern. The serioussness of this is ameliorated by the late break from the triangle.
As if sowing confusion about the pattern weren’t enough, one marketwatcher confused a philosophical principle with an indicator — saying that Occam’s Razor would indicate the trend of the market. The point of Occam’s Razor, is, of course, that the simplest solution to a problem is usually the best one.
Which may have something to say to the present market situation. In May we sugested, gently, that investors might be better off totally hedged. That might be a good tactic for the general investor here considering the climate of uncertainty and the radical volatility. Waiting for climate change could be expensive.


