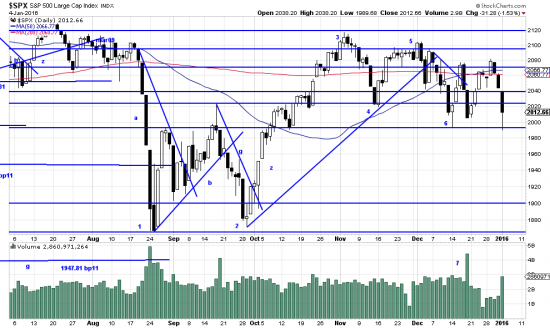
There is a WWII story about a naval convoy in the North Atlantic heading towards Russia. Winter seas there are so violent that shipwreck is very common. In this convoy a carrier was seized by a humongous wave which peeled the flight deck back like the top of a sardine can. The captain of a destroyer following the carrier watched this and said, “My word, that is unusual.” This was our reaction to being greeted by a 400 point air pocket in the Dow upon awakening to the new year.
http://stockcharts.com/h-sc/ui?s=%24SPX&p=D&yr=0&mn=6&dy=0&id=p38955316076&a=266398464
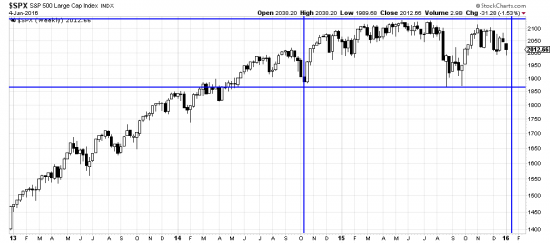
Of course it is the usual list of suspects, using a Chinese airpocket (7% down) as an excuse and raking in obscene profits. These are transient considerations. The real problem is that the bad day comes in the midst of a pattern which is looking more and more bearish. If you just look at the picture over the long term it doesn’t look so terrible:
3 year weekly chart
http://stockcharts.com/h-sc/ui?s=%24SPX&p=W&yr=3&mn=0&dy=0&id=p20137649611&a=432305978
As you see even after this nasty day price is only in the middle of the box. (The box we were not supposed to be trading in.) What it mainly does is reinforce for us the wisdom of not being exposed while price is in the box.
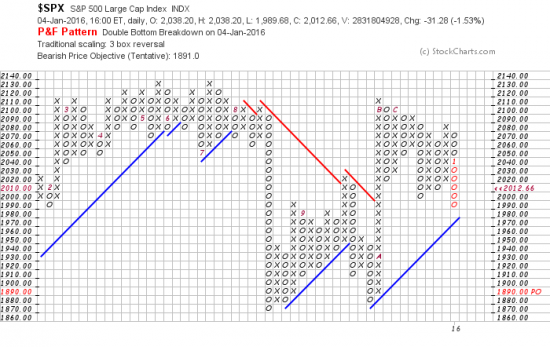
What it does for the market is analyzed by the PnF chart:
http://stockcharts.com/freecharts/pnf.php?c=%24SPX,PWTADANRBO[PA][D][F1!3!!!2!20]
The chart has a sell signal because of a double bottom breakdown. It looks for a target of 1891. That seems extremely feasible to us. Readers should look for heavy seas and secure their flight decks.


