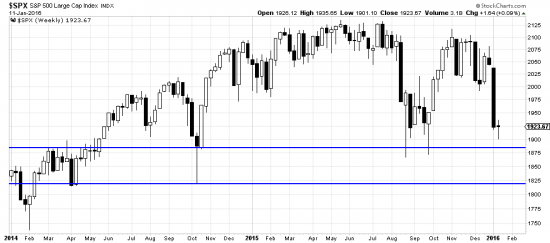
weekly bars
http://stockcharts.com/h-sc/ui?s=%24SPX&p=W&yr=2&mn=0&dy=0&id=p19867336111&a=440585757
We expect, any moment, a bounce from the waterfall wave we have seen for almost two weeks. Perhaps as early as tomorrow (Tuesday). The magnitude of the wave is nothing out of the ordinary (7%, m/l), though the daily waves have been somewhat discomfiting.
The last downwave follows the bear patttern of lower highs, lower lows. Its tail may get caught in the parallel lines, where support lies; but at the moment it looks like a bounce (dead cat) is in the cards. Buying this bounce would be very risky. We won’t.
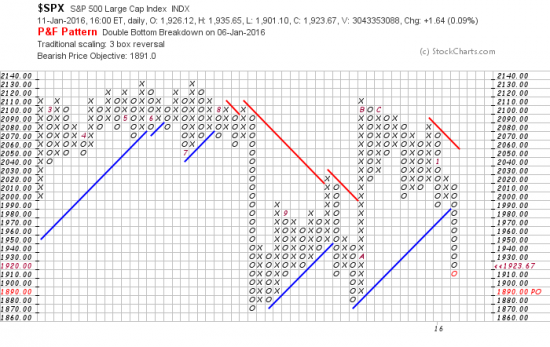
The PnF system looks for a target of 1891 here and that squares up well with the chart pattern.The upper horizontal line represents traditional support. As support areas are frequently zones we have added the lower line.
http://stockcharts.com/freecharts/pnf.php?c=%24SPX,PWTADANRBO[PA][D][F1!3!!!2!20]
Extreme chaos, volatility and machine generated turbulence continues to rule the market. And prices are still in the box.


