http://stockcharts.com/h-sc/ui?s=%24SPX&p=D&yr=0&mn=6&dy=0&id=p70142979615&a=266398464
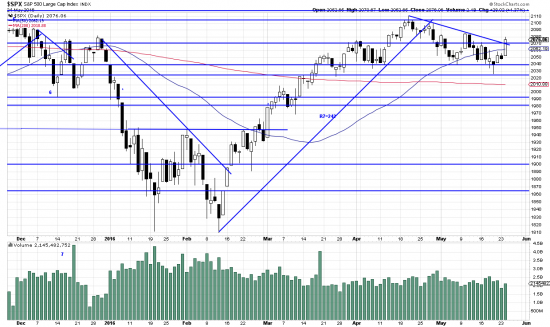
What might be an A_B_C or an alpha-beta wave is throwing off buy signals. Here in the SPX the pattern is not as clean or striking as in other issues, but after listless sideways drifting today looks like at least a small explosion and the buying signals should not be ignored.
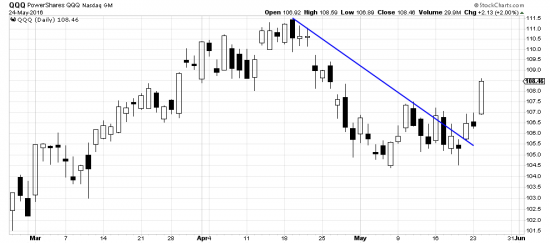
The signals occurred across the market in all the indices. Here is the QQQ:
http://stockcharts.com/h-sc/ui?s=QQQ&p=D&yr=0&mn=3&dy=0&id=p87133033658&a=435391165
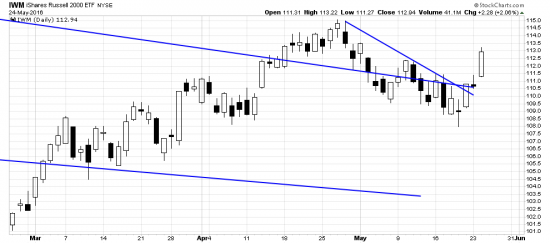
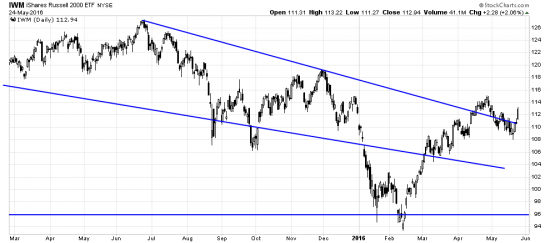
The rally is broad. Here it is occurring in the IWM. This is optimistic for the market as a whole.

http://stockcharts.com/h-sc/ui?s=IWM&p=D&yr=0&mn=3&dy=0&id=p48723314426&a=229975465
http://stockcharts.com/h-sc/ui?s=IWM&p=D&yr=0&mn=3&dy=0&id=p48723314426&a=229975465
http://stockcharts.com/h-sc/ui?s=IWM&p=D&yr=0&mn=3&dy=0&id=p48723314426&a=229975465
Readers should remember that we are in a market of extreme treachery. Our interpretation here would be unassailable in a trending market. In the present sideways contrarian market one must be alert for bear attacks. So set stops 5% down and honor them.


