http://stockcharts.com/h-sc/ui?s=%24INDU&p=D&yr=1&mn=0&dy=0&id=p90213512304
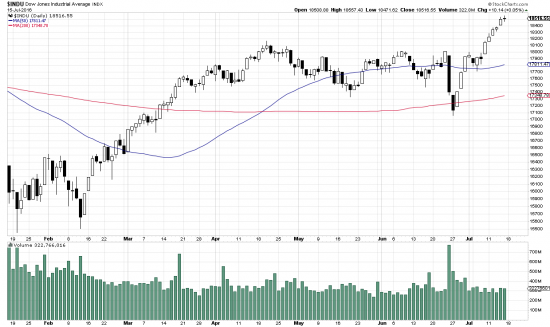
Not much debateable here. All the indices are breaking to new highs.
http://stockcharts.com/h-sc/ui?s=%24SPX&p=D&yr=1&mn=0&dy=0&id=p46911828355
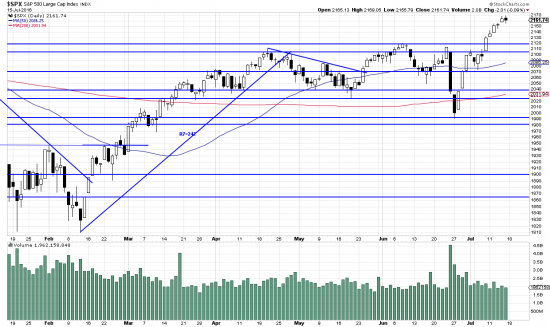
The spx, similarly, breaking away.
http://stockcharts.com/h-sc/ui?s=QQQ&p=D&yr=1&mn=0&dy=0&id=p58769923697
http://stockcharts.com/h-sc/ui?s=%24SPX&p=D&yr=1&mn=0&dy=0&id=p46911828355
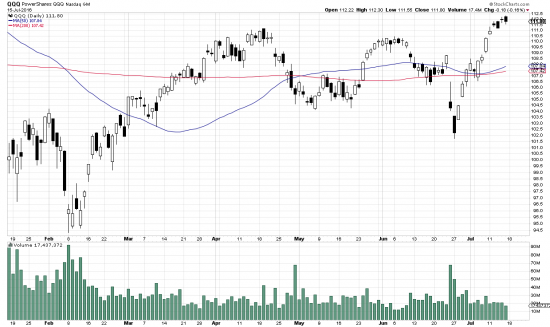
And the qs. Everywhere you look there are buying signals. We are in.
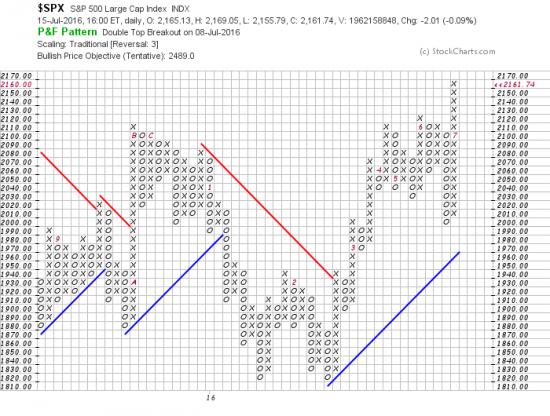
What does it mean? Well one thing it means is illuminated by the PnF chart:
http://stockcharts.com/freecharts/pnf.php?c=%24SPX,PWTADANRBO[PA][D][F1!3!!!2!20]
which looks for a target of 2489 in the SPX.


