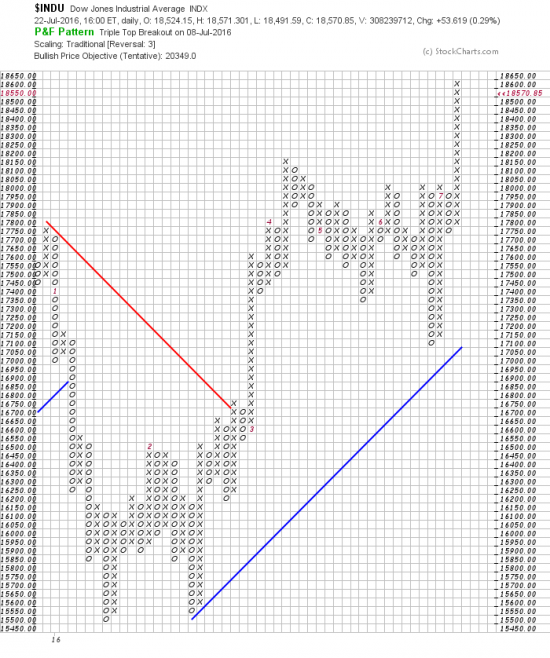
http://stockcharts.com/freecharts/pnf.php?c=%24INDU,PWTADANRBO[PA][D][F1!3!!!2!20]
This is such a beautiful chart, with such long term meaning that we have to show it. 20349 targeted in the Indu. What gives this credence is the months and moths of tedium as the market backed and filled and fizzled and failed. The market doesn’t just do that to test investor faith. It does it to build a platform for the next advance. Being coy the market always tries to leave room for doubt so that only the true of heart are able to reap the rewards of faith virtue and loyalty. (Sorry. Got carried away there.)
Of course it would be no fun if the market left no room for doubt, uncertainty, anxiety, suicidal depression and overeating disorders. So we always throw our capital into the void then hold our noses and jump after it. Is this the time? Is it?! Is it?!
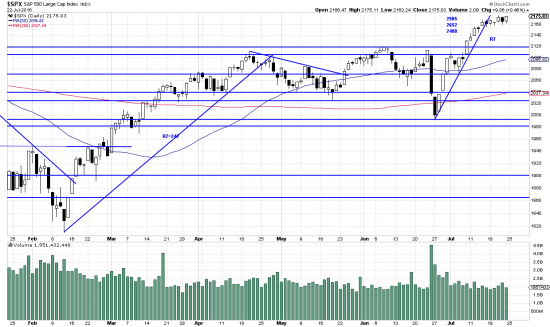
Well the charts are certainly beautiful. All the major indices and issues are looking like rockets:
http://stockcharts.com/h-sc/ui?s=%24SPX&p=D&yr=0&mn=6&dy=0&id=p70142979615&a=266398464
Since we are breaking away in a new wave we ran a rule of seven analysis (http://www.edwards-magee.com/ggu/druleofseven.pdf) on the wavewhich produced targets of 2488, 2652, 2985. Of course we don’t believe such Ouija analysis. Do we? Do you? Of course it has worked like a — dare we say it– charm since mar09. And it helps to provoke the bears who definitely don’t believe it. But they are all licking their short selling wounds right now anyway. Well good luck to them, and happy trails to you.


