There it is. Clear as mud. Why do people say that anyway? Mud is not clear to us. We always wallow in it until we make some sense of it. Clearly there is a lot of mud going on here, and with a crystal ball and a marijuana stock (or a stock of mary jane) we can make something of it. Looked at up close it looks like a triangle struggling to be reborn. Surprisingly from the long view it looks like a top (but of no known identity). Wallowing around down here in the mud we still believe it is a temporary correction, but not buyable because of the excess volatility.
Bogle boggles the mind:
- “I have never seen a market this volatile to this extent in my career,” Bogle said Thursday on CNBC’s “Power Lunch.” (66 years)
- Well Bogle is a lot older than we are. Our career is only 58 years long and we have never seen stock volatility like this.
- Neither has Dow Theory which according to the Theory analysts has issued a sell signal. What we muse about is this: Has the extreme volatility fooled the analysts? If you look at the chart above you see that the Magee Basing Point stop is at 2510. At present it looks like the 200 day moving average is containing prices and the triangle is the dominant pattern. There is no top pattern. (But if this goes on long enough it could develop into one.)

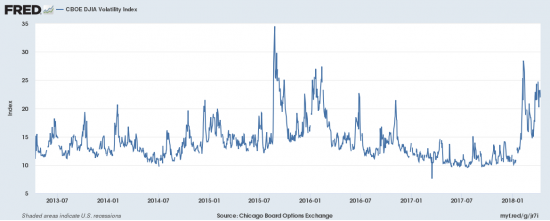
- This chart from the FRED and the CBOE will furnish you with some perspective on relative volatility. An extended period of calm is followed by volatility springing back to the mean. No water for spring time sailors.
- We will inform you when we see clear weather.


