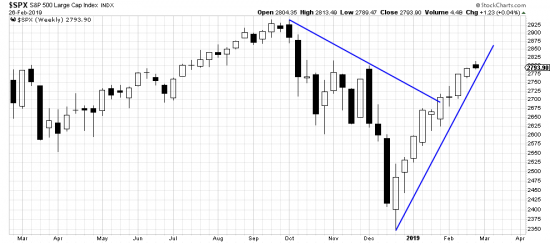
Weekly basis. A weekly basis chart dramatizes recent price action. There certainly is some drama in the chart– 9 weeks of advancing prices. The upshot is essential drama. Price is nose up against important technical and psychological resistance. The price itself is shot with significance: 2800. Centenary numbers have what Gibbon called numen. This numinous character underlies market action, inhibiting advance and when broken acting as an impulsive force.
For the investor waiting is the game until 2800 definitely falls, and then adding on or increasing commitments. That the market is at a tipping point can be seen from the latest trendline–too steep and too overbought. This marked condition reinforces a waiting policy.
The situation is further illustrated in the daily chart. The speed and violence of the advance is reflected in the trendlines from the low. There is no anchor point for a trendline. (An anchor point is the low of a correction or reaction against the trend, regardless of its length.)


