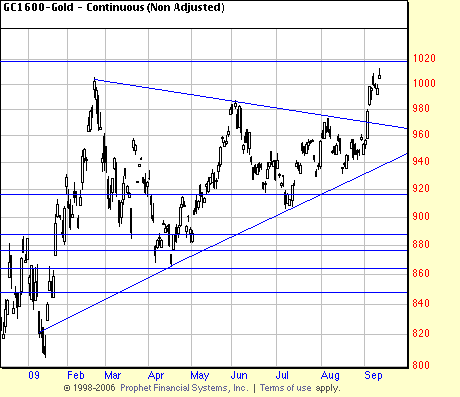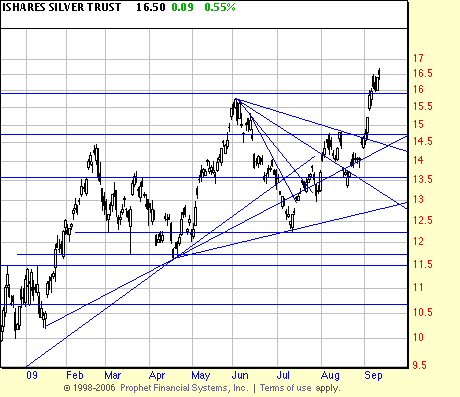
 After being spooked by what looked at first glance like an exhaustion gap we followed good practice and set a stop instead of bailing on gold. So far this is productive. Now we have an up gap — a bullish signal, in fact you could, if aggressive, add to your position. Note: aggressive. Of course the new high is bullish also.
Now that the momentary excitement has passed we should look at what all this means. It all looks very bullish — but it is too soon for runaway gold fundamentally and the IMF is waiting out there to spoil the party with massive physical sales.
But let us consider the implications of the pattern without worrying about Halloween tricks from the Treasury and the IMF. This pattern is about 200 points deep. Conventional measuring techniques can be applied in two ways. You could add 200 points to the top of the formation (1005 basis futures) and call that the target. Or you could measure from the apex of the triangle (961 more or less) — a more conservative method.
There is yet another method described on p. 121 of the 9th edition complicated to explain here .
As everyone knows we are casually dismissive of targets and measuring as we feel that each moment is a distinct moment in time and every context is unique (we always duck when we say this in order to avoid any tomatoes thrown at us by zen masters who might be present and policing zen cliches), so we prefer to evaluate price in relation to Basing Points and patterns. The stop we set last Thursday is really too tight except for the most aggressive of traders. The real Basing Point and stop is 5% under the August low. That amounts to a fair chunk of capital. But it is the safest way to stay long the entire move. You could use another method, that is setting a stop based on the average true range — say 2 or three atr’s below the recent high.
We will address this question at greater length later today or early tomorrow.

