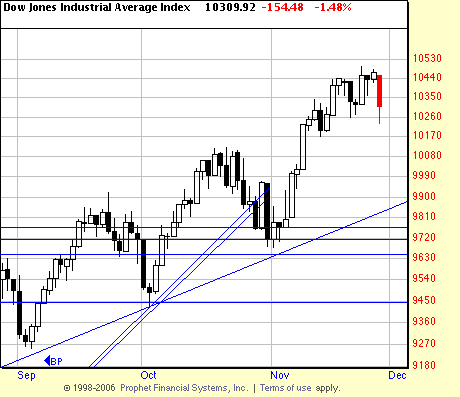
One never knows what falling pebble or snowball will start the avalanche. The jungle drums say that many big traders are short — and feeling the heat. And praying fervently for a severe downwave to get them off the hook. Whether this is the snowball (Snowballs in Dubai? Christmas presents from Muslims? Well isn’t there an indoor ski mountain in Dubai? Could this be a negative indicator? When tropical hotels start building indoor ski slopes sell them short? But we digress, enough of cultural and economic analysis…)
We have been talking lately of blow-off and climax, and of course Elliott Wave is 200% short. So Readers will derive comfort (after a nasty day in the market) from the table below. The figures show acceleration (16 days up, 3.73% higher high), and certainly the pattern around the top shows more volatility.
Here a note from Magee is in order. As you will remember (if you have done your homework and read StairStops) a 3% higher high can be used to advance the stop, using the new high day as a Basing Point. We have not yet decided whether to use this stop or not. We intend to use the Thanksgiving weekend to examine skirt lengths, hair styles, and astrological tables to see if this seems warranted. It is worth noting that in the ETFs today they made monster gaps down on the opening (specialists rejoice!) and then spent the shortened session clawing their way up to finish the day looking like reversal bars (white).
Using variant one of the Basing Points procedure the stop is somewhere south of Dubai — 9195.00
| Start Date | End Date | Start | End | Points | % | Up | Down | Drift | % up | % down | High |
| Days | Days | flush | to high | ||||||||
| 3/6/09 | 5/8/09 | 6469.95 | 8587.54 | 2117.59 | 32.73% | 45 | 32.73% | ||||
| 5/8/09 | 5/21/09 | 8587.54 | 8221 | -366.54 | -4.27% | 9 | 13 | -4.27% | |||
| 5/21/09 | 6/11/09 | 8221 | 8877.92 | 656.92 | 7.99% | 15 | 7.99% | 3.38% | |||
| 6/11/09 | 7/8/09 | 8877.92 | 8087.18 | -790.74 | -8.91% | 19 | 23 | -8.91% | |||
| 7/8/09 | 8/7/09 | 8087.18 | 9437.71 | 1350.53 | 16.70% | 23 | 16.70% | 6.31% | |||
| 8/7/09 | 8/17/09 | 9437.71 | 9116.59 | -321.12 | -3.40% | 6 | 10 | -3.40% | |||
| 8/17/09 | 8/28/09 | 9116.59 | 9630.2 | 513.61 | 5.63% | 10 | 5.63% | 2.04% | |||
| 8/28/09 | 9/3/09 | 9630.2 | 9252.92 | -377.28 | -3.92% | 5 | 9 | -3.92% | |||
| 9/3/09 | 9/23/09 | 9252.92 | 9917.99 | 665.07 | 7.19% | 14 | 7.19% | 2.99% | |||
| 9/23/09 | 10/2/09 | 9917.99 | 9430.08 | -487.91 | -4.92% | 8 | 11 | -4.92% | |||
| 10/2/09 | 10/19/09 | 9430.08 | 10117.98 | 687.9 | 7.29% | 12 | 7.29% | 2.02% | |||
| 10/19/09 | 11/2/09 | 10117.98 | 9678.95 | -439.03 | -4.34% | 11 | 11 | -4.34% | |||
| 11/2/09 | 11/23/09 | 9678.95 | 10495.61 | 816.66 | 8.44% | 16 | 8.44% | 3.73% | |||
| 11/23/09 | 10495.61 | 10231.25 | -264.36 | -2.52% | 4 | -2.52% |

