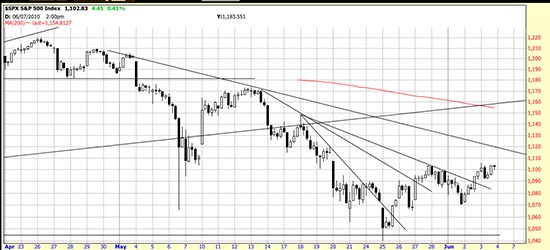
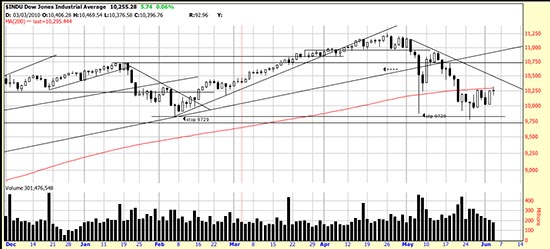
 Wonder of wonders. An upwave in the Dow? Here the 90 minute bars in the Dow. As is obvious either a reversal or a consolidation is taking place. As readers know patterns of this type can continue the trend (short term down) or reverse it. This pattern appears to us more a reversal than a continuation — but it is unresolved as yet. It actually looks like to us a kilroy (or(h&s) bottom. But short term data like this can be unreliable. As can be seen from this intraday chart an upwave started 7 days ago. This is a surprise to us on looking closely at the chart. It may be better seen on the daily chart.
 The downwave –as we say speaking provisionally, because it can easily resume — lasted 22 days, 1483.53 points and 13.18%. The seven day upwave is up 4.10%. Three days up, two down, two up, and higher highs (by the width of a razor’s edge). Still, to repair the damage done here it will be necessary to take out the high of May. Also prices are in fact below the 200 day moving average, which many market participants hold sacred. We use Magee’s rule as to the importance of the penetration — that it should be 3%. At the moment it is climbing back.
Now, one of the most dangerous things you can do in trading is justify your position, or look for arguments that make you right. The reader can evaluate for himself the analysis we present here. As an objective fact our stop resets not too far below the market and if it is hit (close only) we will be out. But we were certainly surprised when we made this analysis, because the market situation has looked so nasty for a month.

