http://stockcharts.com/h-sc/ui?s=$INDU&p=D&b=5&g=0&id=p75064008702&a=203281655
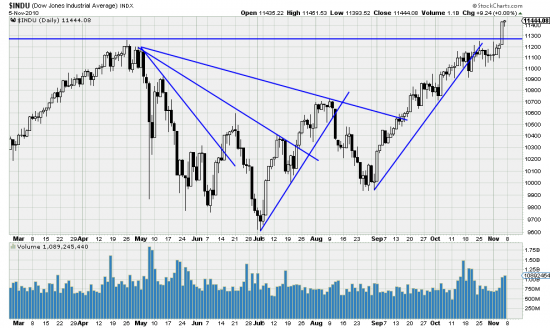
Signals are like men. Sometimes they are dependable, sometimes not. Thursday’s power bar appears to be a very strong signal, and only time will tell. But as analysts, traders and investors not acting on that power bar would be a failure of method and discipline. These remarks are addressed primarily to traders. Trend followers should have been long for weeks, or months.
The downwaves can be looked at as painful, or cathartic, but they must be bourne (probably born to you) by long term investors. Over and over and over we have seen equity fluctuate through painful downwaves only to have the pain washed away by large profits from long trends. See for example the 13 year trade in MSFT which would have been possible using weekly Basing Points.
This breakout is not just a breakout of the little drift pattern we have pointed out recently. It is also a new high for the market. Disciplined traders buy new highs and curse the market if the signal fails and they are stopped out. But they buy it.
http://stockcharts.com/h-sc/ui?s=TLT&p=D&yr=1&mn=0&dy=0&id=p20970412253&a=203282126
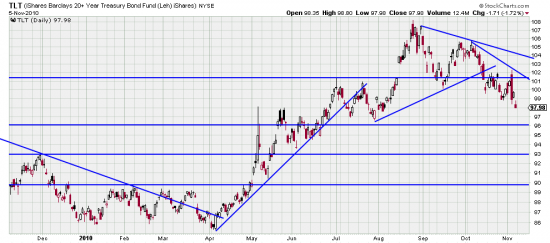
Is there any doubt that the TLT (bonds) is (sic) in a downtrend? We bought TBT some weeks ago. If you are long these get ready to meet Enron in trend followers hell.


