 http://stockcharts.com/h-sc/ui?s=TLT&p=D&yr=1&mn=0&dy=0&id=p20970412253&a=203282126
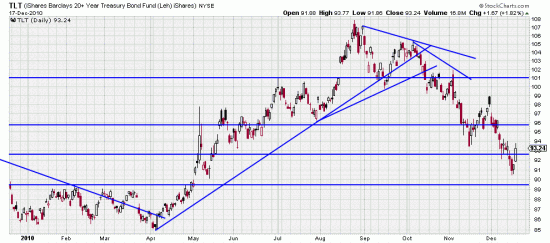
Any questions about where interest rates are heading? If so these charts should answer them. While the punditry and the media lie and misrepresent the chart tells the truth. The long term trend lines are broken. When you sit on positions in this situation you wind up being a major investor in Enron and WorldCom –or Bear Stearns.
 http://stockcharts.com/h-sc/ui?s=MUB&p=D&yr=1&mn=0&dy=0&id=p81774675545&a=217816771
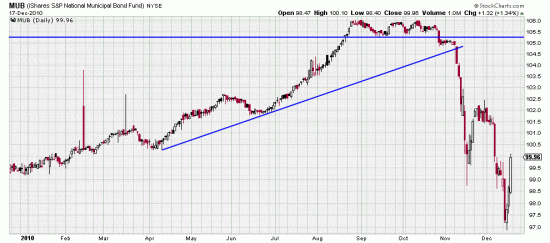
We are of two minds about MUB. (or maybe more minds.) The major damage is done and bottom fishers are hopping on the trade. Of course they have already hopped on it once. In reference to that trade in November. That’s what it was an automatic bounce trade. It attempted to form a flag — which failed. When rocket power bars like this form and very shortly thereafter see a counter powerbar in the other direction good traders fold their tents and steal away. Or run like hell. The signal line was at the low of the seven day attempted flag. Ironically a flag did form — but on the downside. When that flag was struck we got the automatic bounce going on now.
With a likely dividend yield of 12% bottom fishers are fishing hard. On the other hand all we need is one municipal default and this will look like Enron. And frankly we think some cities should default. You could also treat it like a trade but don’t even think about its going back to 106. In a case of a trade we would stop it 1 or 2% under Friday’s low.
We are musing as speculators. Cautious investors might look on municipals as the next frontier in the PIIGS saga.

