 http://stockcharts.com/h-sc/ui?s=$INDU&p=D&yr=2&mn=3&dy=0&id=p21251836326&a=227822935
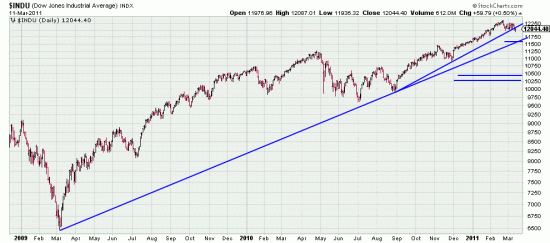
Here is a spectacular view of the great trend since Mar 09. The Basing Point stops we have been discussing recently are better illustrated here: Reading down, V2 new high stop: 11565.xx, V1 Wave Low stops: 5%: 10382.xx, 6% 10273.xx. The link will allow readers to view it blown up.
This chart is a marvel of technical analysis. The topmost stop coincides amazingly with the long term trendline. The lower stops are so obviously indicative of major trend changes that they are unassailable. The drawing of the long term trendline here absolutely locates the technician in the market: it’s a significant distance down. The September trendline has been broken, but it is too soon to tell all the consequences of that break. We’re seeing them right now.
We are continually advocating that readers make it a practice to be neither right nor wrong, but somewhat right and somewhat wrong. That is instead of liquidating or hedging an entire portfolio on a tight stop (as the V2 stop), hedge it in tranches — for example, 3 tranches, or five or whatever you analyze about the market. A minor hedge on the first trend break makes it easier to increase the size of the hedge if the market continues to run against you. The money you win or lose is not the important thing. The important thing is the confidence that comes from executing skillful trading plans.
We will be adding-on to our index positions when this downwave plays itself out.

