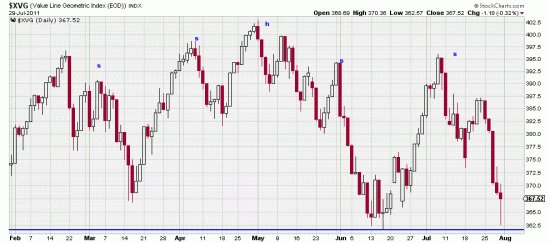
Another nail in the market’s coffin illustrating the 4% rule in the Value Line. Note that even the Value Line shows head and shoulders characteristics.
While the politicians are busy burning down Rome the market is not ignoring their handiwork. Last week the market threw off a sell signal that has ominous implications in the present circumstances.
Thirty or forty years ago Marty Zweig published the 4% indicator (attributed to Ned Davis). Like landmines that sleep quietly subsurface till someone steps on them the indicator has slumbered peacefully until this week, when the Dow was down 4.2%. Zweig’s indicator was not based on the Dow. Rather it was based on the Value Line. The Value Line was down almost 5%.
Zweig demonstrated, and recent studies have re-validated the method – that buying a 4% upweek in the Value Line (or selling a 4% downweek) resulted in performance nearing 20 times better than buy and hold. The Value Line index is used as the signal, and the trades are made in midcap indexes –or actually, in our opinion almost any of the indices.
We don’t think you have to believe in this signal to have pessimistic expectations for the market this coming week. We will be mildly astonished if Monday the markets do not send the Washington arsonists, hobbits and trolls and economic know-nothings a stinging message. (Assuming they haven’t magically produced a compromise on Sunday.)
As if the 4% sell signal weren’t bad enough there is then the rule of seven to work on the S&P. Based on this week’s downwave, by the rule of seven the market is calculated to reach 1235.43 on the next wave, then 1198.75 on the next, then 1124.76 on the next and then 903.42 before this series of waves exhausts itself. These are theoretical price targets, not guarantees but it is true that this target calculation technique has much respect among technicians. An article on the technique which Sklarew described is at
edwards-magee.com/ggu/ruleofseven.pdf.
In addition to targets from the rule of seven there is the head and shoulders measuring rule, which targets 1197, approximately.

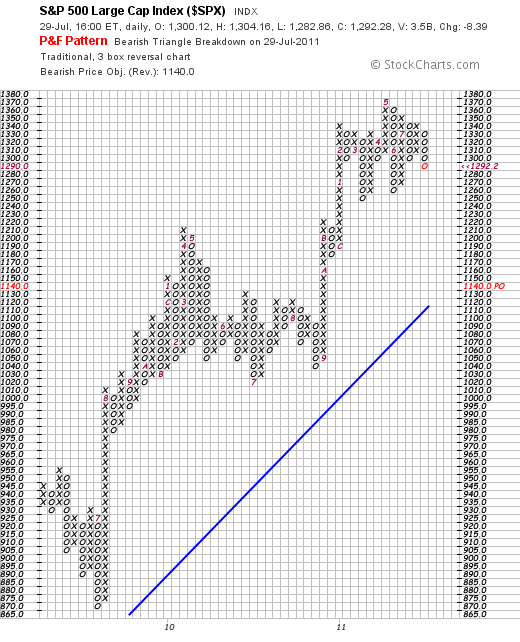
Running the Wykoff point and figure measuring formula the target is: 1010.58. Stockcharts.com, using its own algorithms sees the target as 1140.
As always edwards-magee.com is not predicting, and we do not stand behind our forecasts. This market analysis is just that – an analysis using the tools of the trade. Every analysis has a 50% chance of being wrong. However investors must use the conditions of the moment to take their positions, and these conditions are very dark at present. We have been shrieking Cassandra-like for months, pointing out the gathering storm. For our personal accounts we are now short the S&P (on the close Friday) and long gold. Most everything else is flat.

