 http://stockcharts.com/h-sc/ui?s=$SPX&p=D&yr=0&mn=9&dy=0&id=p82246327493&a=214966864
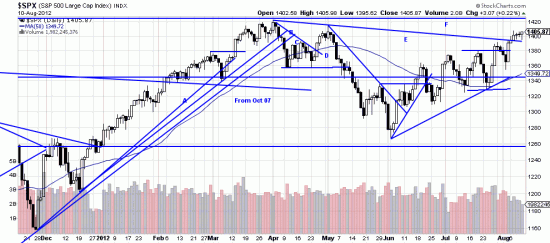
Just looking at this chart the trend analysis is simple and incontrovertible. We have an upwave with 4 higher lows and 4 higher highs. In each of the wavelets contrarians have attacked the wave but have not been able to break to a lower low. The message is clear. We should be long and looking to get longer. We are not proud of the E trendline here. if someone else put it up we might carp. Maybe it was our evil twin Karnak who did it. Nonetheless it’s there and it’s broken, as is the horizontal line.
The prophets of doom and gloom foresee a recession worse than 2009. And if Congress doesn’t pass some stimulus and jobs programs they may be able to make that come true. But we don’t see it imminent.
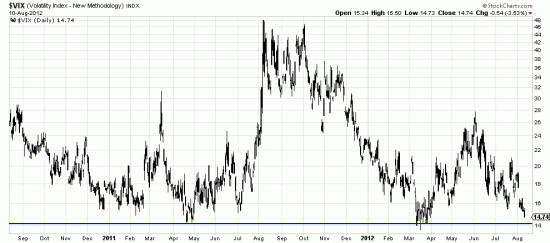
One thing we do see imminent is a VIX level low enough to catch the eye.
 Two years of the VIX. Some kind of explosion is coming. The VZZ etf is a leveraged instrument. If the VIX explodes it will do 2x. Some people will be buying it now just as a hedge. We haven’t made a decision in that direction yet. The TLT is saying that it’s risk off time. You can play the short side of it with TMV.
The doom and gloom people are talking of a top. Unfortunately they don’t know how to read a chart. Tops and crashes have never occurred at this stage of a market’s life. Don’t tell them. It’s fun to watch them swarm around like bees deprived of their queen.


follow through of large speculators in COT – except in SPX but non knows the difference between large specs and commercials there anyway.