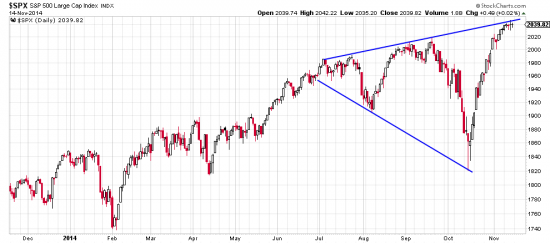
http://stockcharts.com/h-sc/ui?s=$SPX&p=D&yr=1&mn=0&dy=0&id=p64823856337&a=376488190
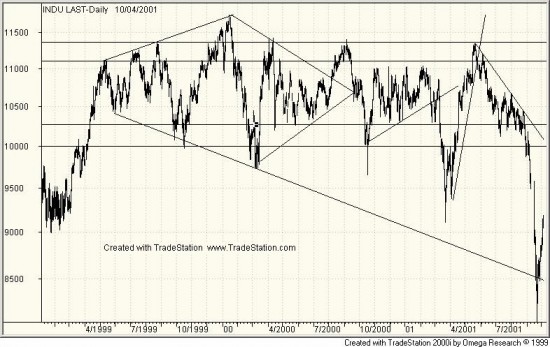
It is gratifyig to have intelligent and alert readers. One of whom looked at the above chart and said, isn’t this a broadending pattern? Broadening patterns have large implications and are usually top formations. Here is a chart of the 2000 top — a broadening formation which turned into a diamond.
(p.133, 10th edition)
We don’t think the recent formation is a broadening top. If it were the implications would be cataclysmic. We regard it as nothing more than an extremely violent conclusion to this (or that) phase of the bull market. The waves built up slowly — 16 days and 5.775% in June and July; 14 days and 4.79% in August; and the final violent wave 18 days and 10.68% in October. We regard the plunge of September-October as more a perfect storm of market conditions which caught major traders and hedge funds the wrong way and bloodied their noses. Momentum traders and permabears exacerbated the downwave. Anyway it was time for a correction.
After such a wave we must expect a reaction. It is foolish to predict but why not. At the moment we think there will be a sideways consolidation about 30 or 40 points deep — like those of July and September. No one should depend on this. Predicting is the best way in the world to get egg on your face.
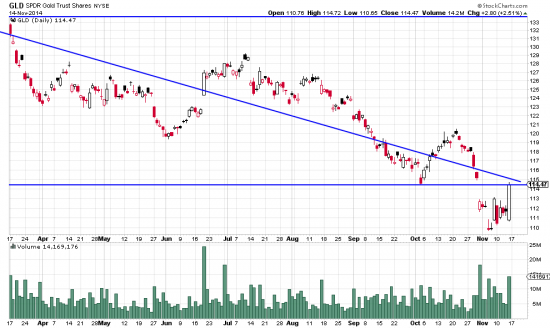
 http://stockcharts.com/h-sc/ui?s=GLD&p=D&yr=0&mn=8&dy=0&id=p41464206587&a=349299071
Friday the silver market bloodied our nose and wiped out a nice little profit we had going. We halved our position and went long gold. After all ISIL (the caliphate wannabe) is planning gold backed currency. This will undoubtedly gain them many US supporters.


I saw a nice little profit in silver vanish too.
Was that an inverted flag in SLV on Oct 31-Nov 4?
I’m wondering if I missed a flag flying at half-mast, and whether you believe the pattern was there and if so should alert traders have recognized it and bailed on Nov 5-6.
Regards,
Rick