http://stockcharts.com/h-sc/ui?s=%24SPX&p=D&yr=0&mn=6&dy=0&id=p38955316076&a=266398464
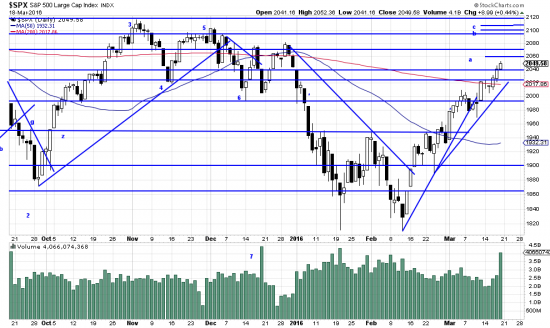
Literally a nose to supersede three important wave highs: 2080, 2104, 2116, labeled on the chart as a,b,c. Distance is less than a nose: .015, .026, .o32. When the last of these is taken out the entire structure of the market will be changed — actually in quite a dramatic fashion. The downtrend that started in November will be canceled and we should be looking at the beginning of a new upwave — probably of some consequence.
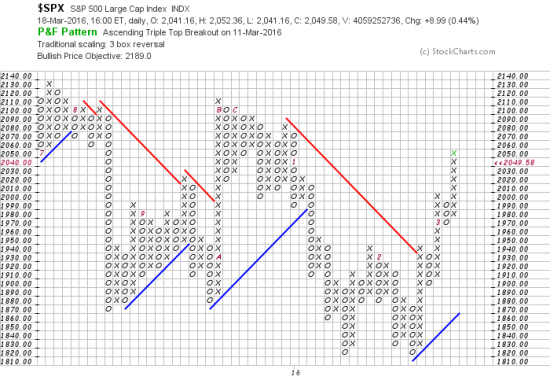
In fact the PnF system looks for a target of 2189.
http://stockcharts.com/freecharts/pnf.php?c=%24SPX,PWTADANRBO[PA][D][F1!3!!!2!20]
As if didn’t look like spring, note the volume on Friday on the first chart. Now is the winter of our discontent made glorious summer…


In the interests of trying to keep things simple at a time when charts are hard to read… wondering if you see what I see which is an incipient inverted head & shoulders formation in SLV? (from July 2015)