john magee technical analysis::delphic options research ltd

January 18 2002
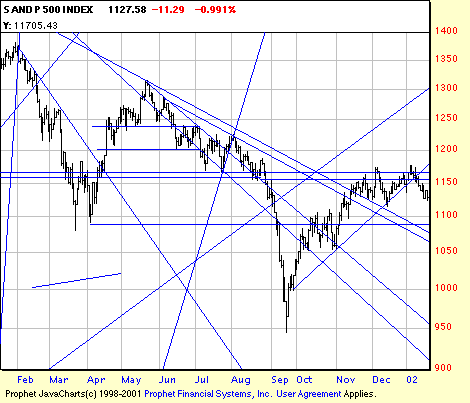
The reaction of the last 10
days has been sharp and dramatic. In December we opined that
January might be a terror. A question yet to be resolved. Nonetheless
the nearest important (moderately) low at year end was decisively
taken out and now the low from mid-December is in easy range.
Note that there was a minor broadening formation over the year
change. We remain skeptical of bullish positions. In fact in
the Dow we think short positions have very limited and identifiable
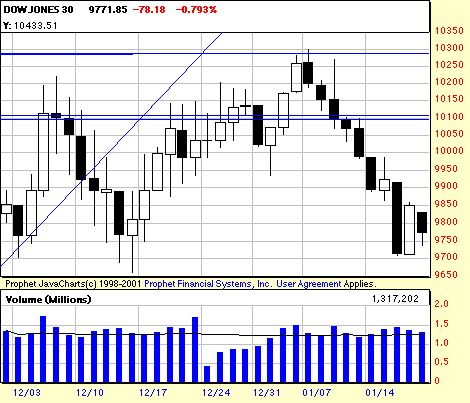
risk. The candlestick chart of the recent Dow below is illustrative.


 December 23 2001
The present secondary has
been impressive in its power, although on disquietingly low volume.
A bearish sign. We watch with interest to see if the early December
highs will be taken out. Our analysis says that the accumulated
resistance here is too great. If we are wrong it will be the
first time we have miscalculated (today). Actually our analysis
of this market has been dead on for 27 months. We are most uneasy
and would be out, hedged or shorting, or maybe not in equities
at all, but in options. (A Coming attraction.) Speaking of terrorism--January
could be terrifying.


 December 5 2001
We have habitually divided
our comments into trader and investor conceptual areas. Reconsidering
our recent comments on advice to traders to begin peeling off
positions we would like to point out the Magee method of near
(or tight) progressive stops. Using this method the trader moves
his stop up daily to 1/8 under the low of the previous day, on
close. If a trader were long the present (impressive) rally the
stop might be placed under the low four days ago. Another way
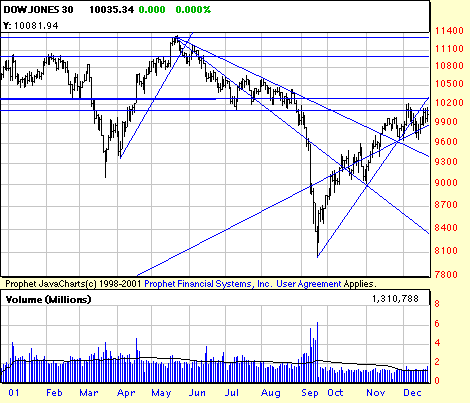
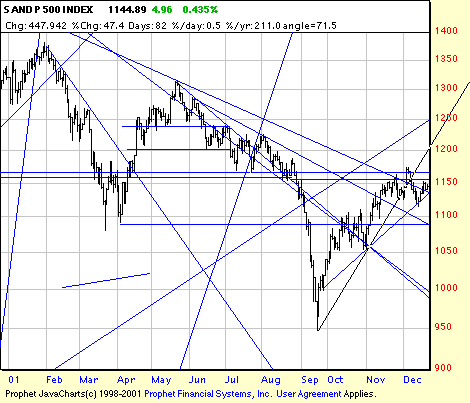
to stop it would be on the break of the September trend line.
Note that prices have not climbed back above the long term trend
line. And note also that the rally is now entering the area of
maximum resistance, 10200-10400. In fact, this is the first real
test of the rally's sincerity. If this is a bull trap it is a
beauty.
 Dow 6 Months, candlesticks
Note the graphic illustration
of the rally with the use of candlesticks.
To
Letters for November 2001
The
comments below have been superseded by our
Major
Turning Points Letter of October 2001
From our comments
of January 2000
Long term investing: (from our comments of
Jan 01) We see no reason to change these comments this week.
Isn't that boring?
Dow: The Dow can expect to find support at
10000 and is buyable, but in small commitments or portions of
a portfolio or additions thereto. We expect to see it in a very
large see saw from 9-12000 for some time and would hedge at the
high end and increase commitments and lift hedges on oversold
conditions at the low end. Jan
15: Don't hang up. We change our minds everyday according to
the conditions of the moment.
S&P: We have pretty much the same opinion
about the S&P with the range being 1200-1500 and would follow
the same strategy.
NASDAQ: This thing is on wheels--either that or a Roman candle (not referring to candlestick patterns, but to the fireworks.) Can you buy it? If you're faster than a scalded skunk. At least there is a line of defense about 3700. But it's definitely playing with fire.
©1999-2000 w.h.c. bassetti dor
|