john magee technical analysis::delphic options research ltd

July 23 2002
Attempting to buy the bottom
here will be like trying to catch the falling knife. Intelligent
Magee chartists will let the paniced and the greedy kill each
other off and mop up the carnage later when a bottom has formed.
Next, real estate.
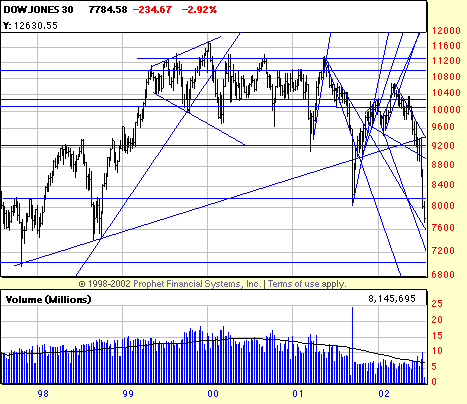
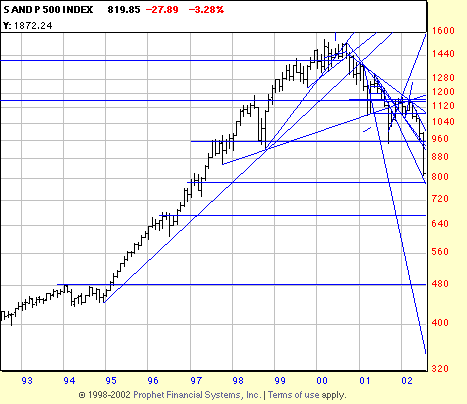
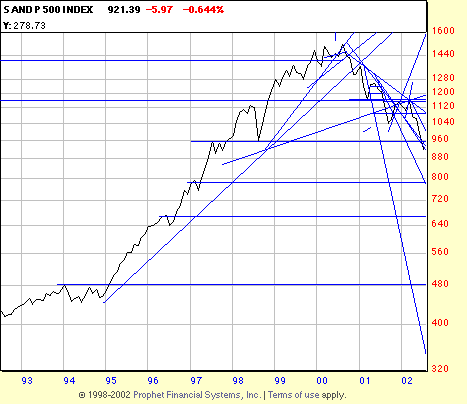
If the formation from 98 to
02 is a head and shoulders, a possibility, then the S&P could
be headed for 480.
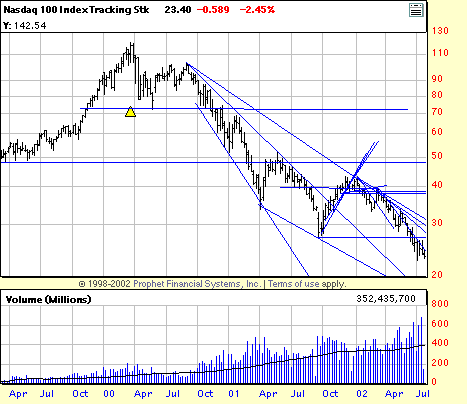
Eerily like 1929.
July 14 2002
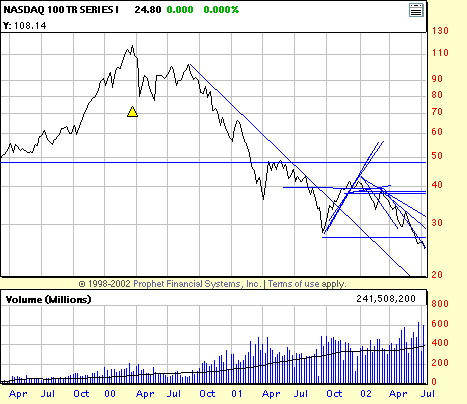
A bull market that died hard. That actually was dead for some years, unbeknownst to those unfortunate fundamentalists who can't read charts. And the naive, analyst misled. It would be interesting to us to know how many of our readers read our letters and didn't act. Next time of course they will and that will be the time we make a mistake. Sigh. The Dow is shown from the beginning of the present down trend. Line charts of the qqqs and S&P are shown to dramatize the situation (if that is needed). As we have remarked the qqqs look like the chart of 1929 Dow. Neatly answering the question, can a market take back more than 100% of its base? In case you are curious as to where we think the base of the S&P is it is between 400-480.
We have repeatedly asserted that this was not a market to be long of. For three years (since .82 to the dollar) we have been saying investors should get long the Euro. So much for prophets being without honor. We are now considering and writing a letter on where investors should hide now. If you guessed real estate guess again. The new letter, titled "What to take to relieve the hangover: Investment Policies for the post debacle." Interested readers should email edwards-magee@edwards-magee.com to be informed when the letter is ready.
Chastened readers who may
now see the simple power of technical analysis and are willing
to go back to the drawing board (or school) can examine our seminars
this site, or email ejosias@ucd.net.
  June 21 2002
We continue to be astounded
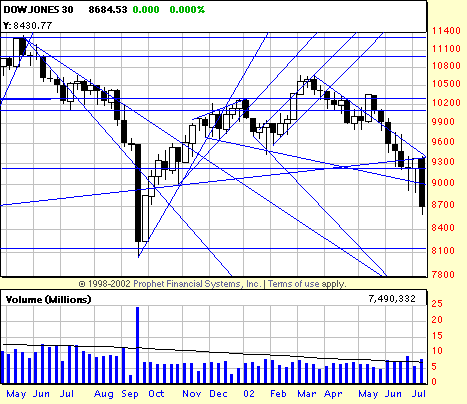
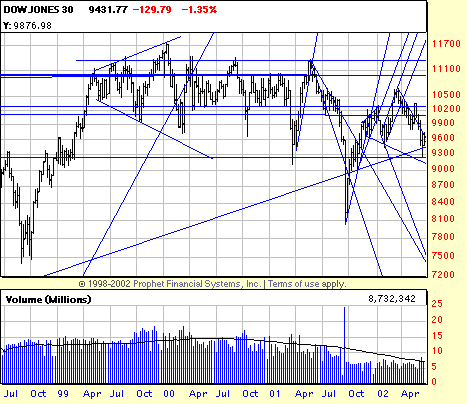
at the pollyannish tone of the news. Here is the 5 year chart
of the Dow looking more and more miserable at every turn. The
bull market ended in late 1999 with a broadening top and has
done nothing but dive lower on every sell off, including the
terrorist low. While there have been individual issues which
have bucked the trend this is so clearly not a market for long
(or even mid) term investors that we consider incitement to long
positions a species of denial, ignorance (or in the case of our
friends the analysts on Wall Street) a confidence game. The Dow
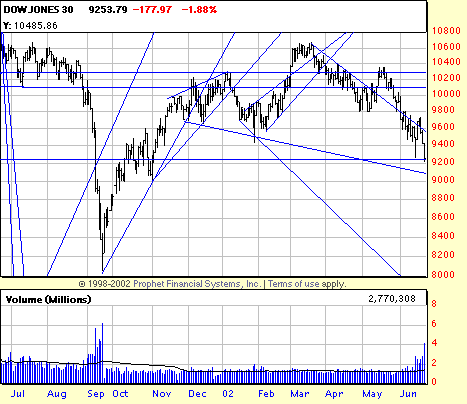
has now taken out the January low and will now test the 9000
level, likely break it and then test the terrorist low. As indicated
by the horizontal line just below 9300 on this chart it rests
on a crucial support area with downward momentum behind it. We
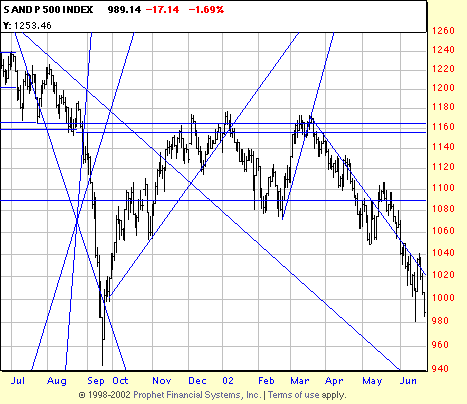
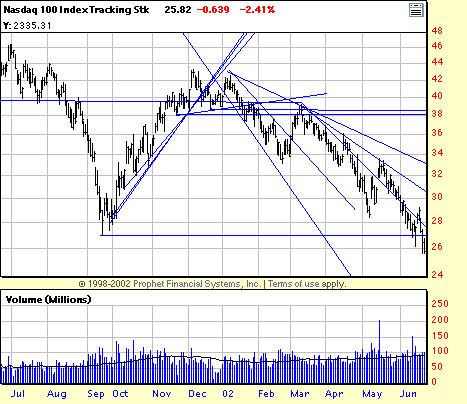
lament the cause for the bulls. The qqqs already look dismayingly
like the chart of the 1929 Dow. The S&P appears already headed
for a test of the terrorist low. Welcome to bear country, and
note, that if you read and understood our letters for the last
three years and are not short or hedged we roll our eyes and
recommend that you see an investment psychiatrist. The doctor
is in. $.05, as Lucy would say.
 April 28 2002
We have breakdowns in all
the major indices. There should be some support around 9900 to
9600 in the Dow. Failure of this support will direct attention
to the lows at 9000. At this point we don't know whether the
sideways trend (the Mule Market) will reconstitute itself, or
whether the terrorist low will be tested. We do know it's not
a time to be long, but we have known that for months, if not
years.
To Letters
for March 2002
The
comments below have been superseded by our
Major
Turning Points Letter of October 2001
From our comments
of January 2000
Long term investing: (from our comments of
Jan 01) We see no reason to change these comments this week.
Isn't that boring?
Dow: The Dow can expect to find support at
10000 and is buyable, but in small commitments or portions of
a portfolio or additions thereto. We expect to see it in a very
large see saw from 9-12000 for some time and would hedge at the
high end and increase commitments and lift hedges on oversold
conditions at the low end. Jan
15: Don't hang up. We change our minds everyday according to
the conditions of the moment.
S&P: We have pretty much the same opinion
about the S&P with the range being 1200-1500 and would follow
the same strategy.
NASDAQ: This thing is on wheels--either that or a Roman candle (not referring to candlestick patterns, but to the fireworks.) Can you buy it? If you're faster than a scalded skunk. At least there is a line of defense about 3700. But it's definitely playing with fire.
©1999-2000 w.h.c. bassetti dor
|