|
 |
 |
Click on image to read more about book and/or order it.
©2002 w.h.c. bassetti dor. graphics ©prophet.net. analyses by and responsibility of jmta::dor
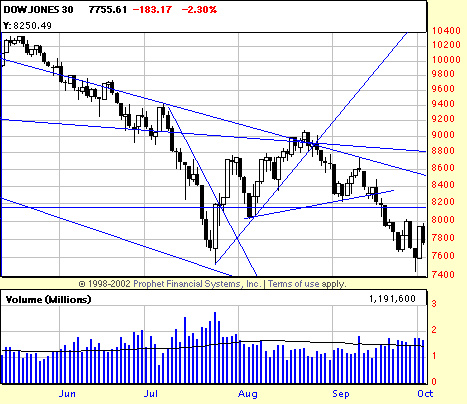
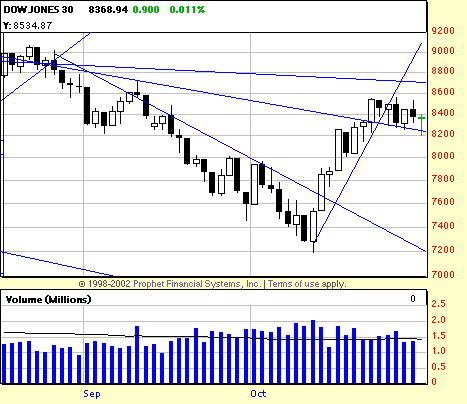
Oct 1 The violent upsurge in the Dow (+4%) is a reaction to the bottom near 7500. Whether the bottom holds or not remains to be seen. Our best judgment is that the bottom will not hold and the downtrend will continue. There is no formula, algorithm or crystal ball which has any certainty on these things.
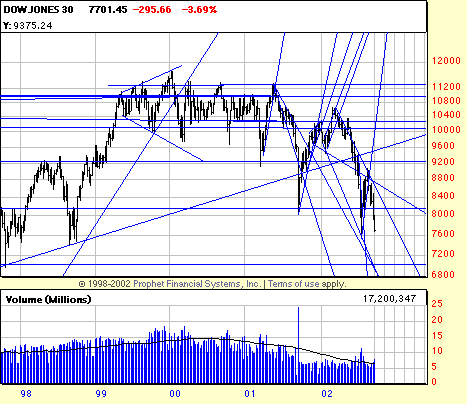
This five year chart of the Dow vividly illustrates the end and top of the greatest bull market in US history. Actually, while impressive, it doesn't hold a candle to the great 17th century tulipomania in Holland. Nonetheless, the long rectangle from March 99 to the fall of 2001, the frequent plunges out of it, and the breaking of the long term trend lines, gave ample warning of the bear market in which we are now immured.
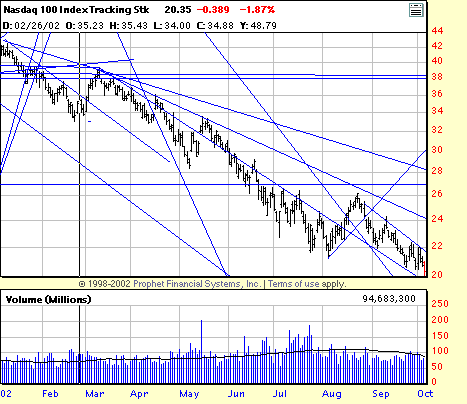
From the 3rd Edition of our Major Turning Points Letter, dated September 13: "Bull, he dead. We think that the most likely course, the course of gravity, the course of least resistance, the course of the greatest pain for the greatest majority is, sorry, Down".
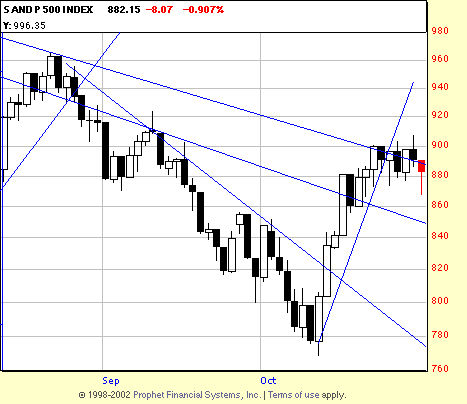
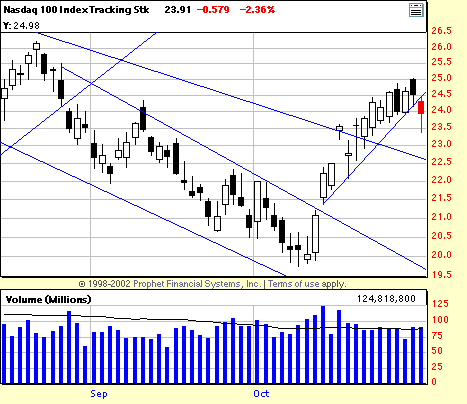
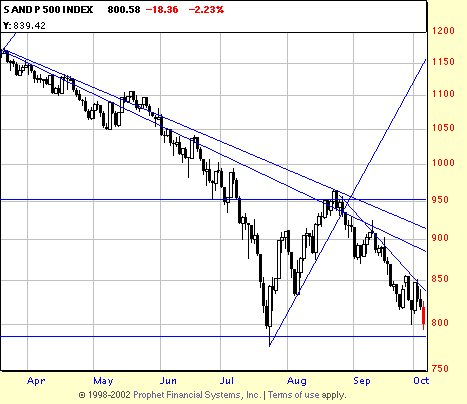
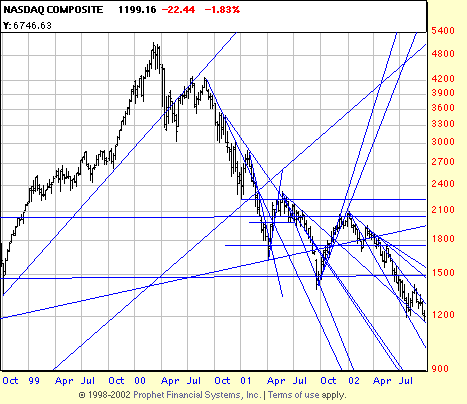
Within days this gloomy prognosis is confirmed. With the August lows taken out, like a homing pigeon the Dow heads for a test of the 7500 low. Is there any one who doubts the pigeons are coming home to roost? The likelihood of the Dow making a bottom at 7500 are severely damaged by the NASDAQ going to five and six year lows. Remember those NASDAQ commercials? "Where do you find such companies?" The real question is where do you find such pigeons as to buy a pig in a poke? Is 1000 possible in the Dow? Keep mind open to all possibilities. Go with the trend. Also, considering the traditional October crash, remember that the 1929-34 Dow saw five waves of panic selling. The inexorable deterioration is vividly illustrated by looking at chart snapshots taken weeks apart. Here immediately Sept 20, below Sept 1 foretelling Sept 20 with the break of the steep short trendline.
A bull market that died hard. That actually was dead for some years, unbeknownst to those unfortunate fundamentalists who can't read charts. And the naive, analyst misled. It would be interesting to us to know how many of our readers read our letters and didn't act. Next time of course they will and that will be the time we make a mistake. Sigh. The Dow is shown from the beginning of the present down trend. Line charts of the qqqs and S&P are shown to dramatize the situation (if that is needed). As we have remarked the qqqs look like the chart of 1929 Dow. Neatly answering the question, can a market take back more than 100% of its base? In case you are curious as to where we think the base of the S&P is it is between 400-480.
We have repeatedly asserted that this was not a market to be long of. For three years (since .82 to the dollar) we have been saying investors should get long the Euro. So much for prophets being without honor. We are now considering and writing a letter on where investors should hide now. If you guessed real estate guess again. The new letter, titled "What to take to relieve the hangover: Investment Policies for the post debacle." Interested readers should email edwards-magee@edwards-magee.com to be informed when the letter is ready.
Chastened readers who may now see the simple power of technical analysis and are willing to go back to the drawing board (or school) can examine our seminars this site, or email edwards-magee@ucd.net.
©1999-2000 w.h.c. bassetti dor
