 |
November 28 2004 Thanksgiving, or early Christmas for bulls?
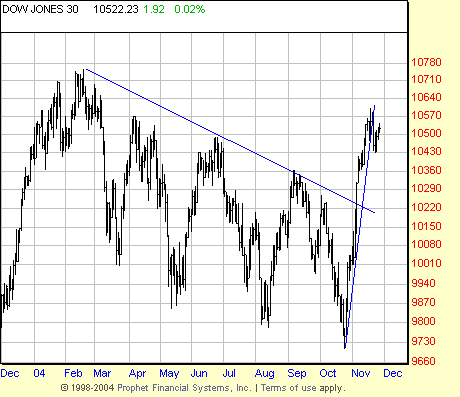
No question the bulls are getting an early Christmas. So why is everyone (including us) looking a gift bull in the mouth? Maybe because everyone (including us) thinks the wrong people bought and it's a trap. And, an important trend line is broken and several important basing points (highs) are taken out. The lack of a bottom formation contributes to analytical suspicions. Does this begin to look like the historic fin de siecle top of the gay nineties bull? (Pardon our French) As with everything in the market we won't know till later. We do know to be on guard.
February top not taken our (yet). No bottom. Price against resistance. And we feel something is about to pop.
|
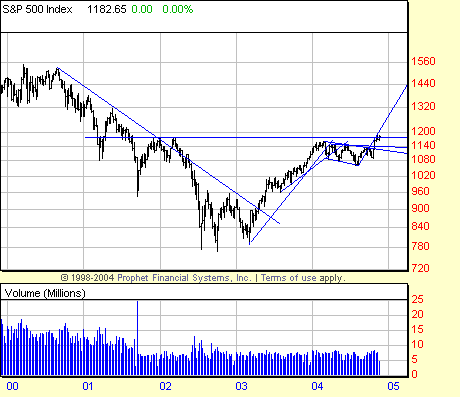 |
The larger context is illustrated by the five year S&P. Looked at from this perspective the bull market of '03 might be construed as a secondary in a bigger bear market. The last nine months of bear market are being questioned by the sharp rally. So far we vote for bull trap. |
 |
A similar story can be seen in the COMPQ but there is no recent breakout. Among the three there are sharp divergences which leaves the market themeless. We think it is all part of the major secular bear market and is a harbinger of things to come. |
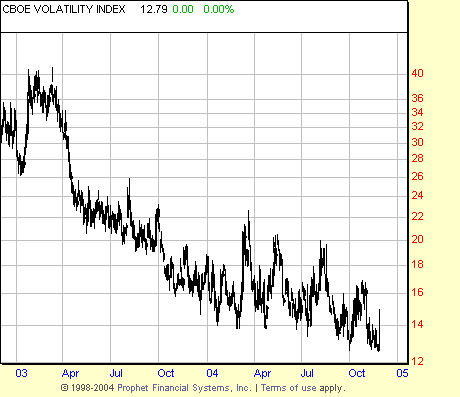 |
Ominous signs in the volatility index. Notice the unusually low readings. Since volatility returns to the mean we can expect some action soon, and perhaps violent action at that. At this juncture the action could be either way. Straddles might be in order. |
 |
November 19 2004 Tha tha thas all folks.
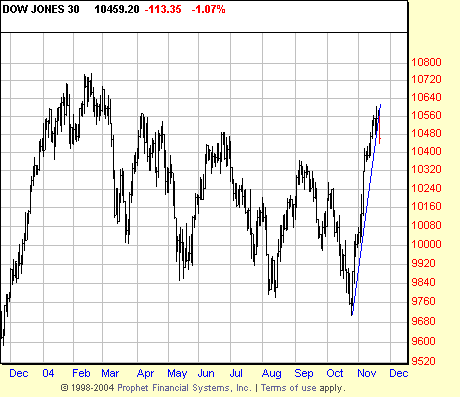
Or is it? Anyway Porky Pig should have the last laugh here. Certainly we never make fun of vicious bear baiting rallies. We are much too kind and compassionate. But given the rocket like nature of this little rally it would not do to disrespect it. Get your head tore off, as them Texicans say. What we say is that it's never over till it's over, but it might be over. Hear any fat ladies singing? Or is that just our ears ringing from having our ears boxed? Friday's retreat on Greenspan's warnings about the deficit and the trade gap may be the beginning of the end. Yet to be seen, but flagpole rallies like this are too steep to last.
|
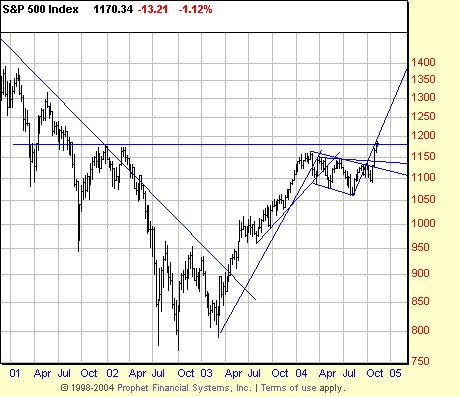 |
Four years is required to get perspective on the S&P. And theoretically (that's a word we hide behind when we really don't believe it) this Kilroy Bottom has about played out it's measuring implications. For student analysts note support and resistance ZONES at work. |
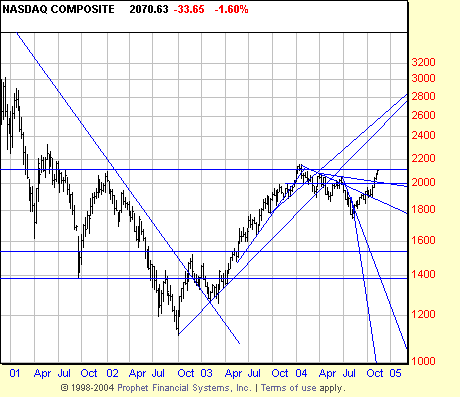 |
Four years are necessary for the COMPQ too. And it is in the same situation as the S&P. The divergence in the indices is obvious and until the Dow confirms these index come latelies and these index come latelies demonstrate that they are serious not to panic. But worry.
What a nasty trick. No don't worry. Good guys and good analysts win in the long run, and often in the short run. Meanwhile we are working on some long recommendations in case "they" are serious about all this.
|
 |
So did you listen when we told you about gold? Are you listening now? |
 |
November 15 2004 Historic bull trap? Or historic bear skin rug?
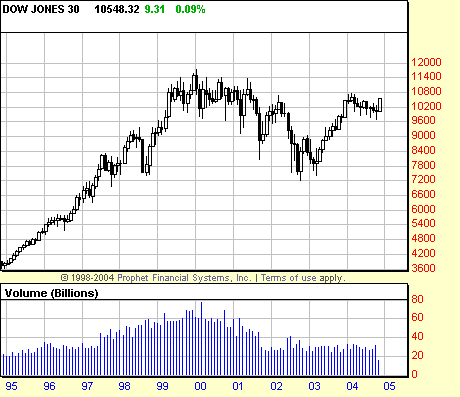
In our experience, one of the more interesting and dramatic charts of the Dow. Good chart analysis says that the election run up is a bear trap as does the support and resistance analysis of this 10 year chart.
We are currently preparing a State of the Markets letter as we contemplate the current rally. Not shown here is the interesting fact that on a chart of yearly bars this year is a doji -- in candlestick terms. Nison says "Doji are valued for their ability to call market tops. ...because a doji represents indecision." Whatever. If price supercedes the resistance here we will eat our charts.
|
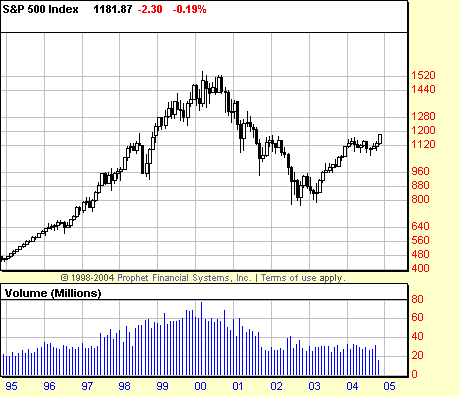 |
Here, in the S&P, where Richard Russell saw (and we agree) a 10 year head and shoulders the end run around the neckline is extreme, and wonder of wonders price seems to have broken out of the short term formation. But an avalanche of supply exists over head.
|
|
|
|
|
|
 |
November 5 2004 Whoa Nellie!
In 9 days the price has wiped out two months of bear market. In our email letter of 102504 we forecast the bounce practically to the minute. And the strength of it has been astounding. What has caused this sharp rally? Many pundits will nod their heads wisely and pundificate about hedge funds, re-election of Bush, job reports, yakka yakka. Meanwhile we know the true reason. More people were buying than were selling. That will do it every time.
|
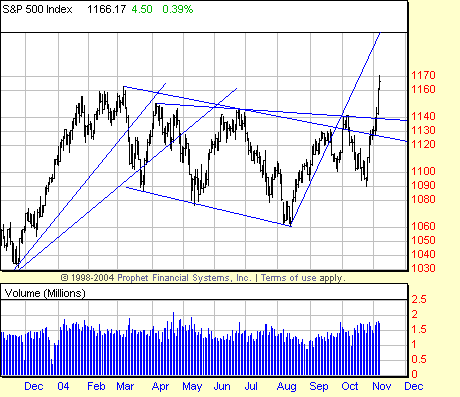 |
Magee used to say that Madame Why had little to say to us, what we are interested in is Mr. How. And we don't care about the meaning of it. (In the teleological sense.) We care about the effect. So the technical effect is to take out the highs of September and October -- with a vengeance, just like those mid-Western fly-over people put a thumb in the eye of those latte sipping Volvo driving liberals in San Francisco. Revenge of the fly-over people! We had predicted a return to the supply line of the channel, but the angle of this rally and its extent are more than a little interesting technically. However it has not yet changed the broad character of this market. It is too steep, too fast, and there is no bottom to the bear trend started in early 2004
|
|
|
|
|
 |
October 29 2004 Halloween Horror
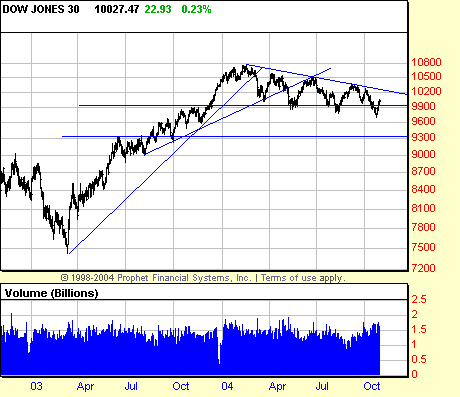
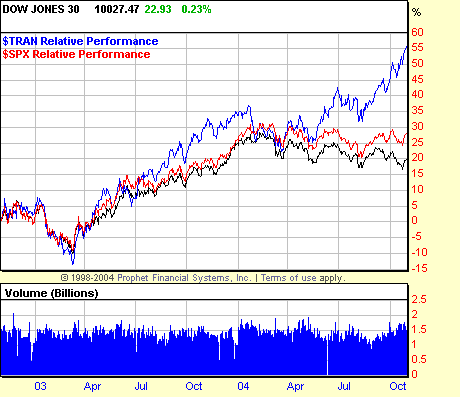
Halloween always comes on the 29th for us, not because, contrary to some of our students' suspicions that we were there for the great event, but because when we sat at the master's knee we were told many horror stories of the Great Crash. And then we watched in many Octobers afterwards as the ghosts of crashes past revisited the Market. Sure enough the ghost of 911 surfaced and bin Laden announced his candidacy for the presidency. October Surprise indeed. Actually it was no surprise -- the market was already half spooked with different issues flying around like quarks, some going up, some going down. Here a vivid depiction of the divergence in the Dow 30 and the Transportation. Just to horrify you the divergence of the S&P from the Dow is pictured. Not pictured is the NYSE which agrees with the Dow.
|
 |
Scared enough? Such divergences may well be resolved by cataclysmic events. We would venture that only two scenarios are likely over the next few months: Continuation of the present situation with the transportations coming back amid broadly downtrending industrials, or collapse of the bullish issues with new lows being made on all sides. Barring the arrival of the Messiah or the Great Pumpkin there is no likelihood of the 2000 top being taken out and in all likelihood 10500 or thereabouts is the high for the foreseeable (and maybe the unforeseeable) future. A sobering if not horrifying perspective: 2 years of Dow with the secondary wave nowhere near its probable length. As is true of other major indices. Horizontal lines show likely near term targets. |
 |
The latter scenario (new lows) appears the more likely (60/40 -- 70/30? 55/45? Well who knows? We don't.) because wonder of wonders! (in case you hadn't noticed, we are in a mini bubble. GOOG at 200? Dreamworks working on investor fantasies working the old IPO scam again? Give us a break! Oops. Freudian slip. Give us a return to reality. The cycles are getting shorter and shorter here. Did we read that there are 9000 hedge funds now operating? From the state of the market we can believe it. When so many fools rush in we can expect the ship to capsize any moment. Ah, Halloween and the ghost of Long Term Capital Management floating over the corpses of dead hedge funds. The main advantage of broken trend lines is it allows naive investors to buy stocks cheaper, thus committing one of the 10 capital crimes: buying a downtrend. Here the NASDAQ is shown offering those very same investors the chance to buy overpriced underpriced stocks. |
|
|


