Mysteries of the Bond Market August 2003
PROFESSOR BONDO EXPLAINS IT ALL
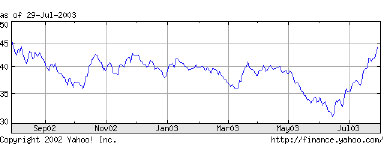
Investors who are not bond specialists may have been shocked by the recent extreme levels of volatility which have plagued that market. (Don’t worry, the specialists were taken by surprise too). As the one year yield graph below depicts, the yield on the benchmark 10 Year Treasury rose from a low of 3.07% in mid-June to a recent high of approximately 4.40% in late July: a 30% increase in little over a month!
10 Y TSY YLD NDX (WCB:^TNX) - Trade: N/A

What caused this extremely vicious sell-off in bonds? Before answering that question, let’s step back for a moment and talk briefly about what drives yields in the bond market.
First we have the “fundamentals,” what your typical egghead economist will tell you are the key variables moving the bond market. The most important fundamentals are:
1) Inflationary Outlook. This refers to the nominal yield that investors require to compensate for anticipated future levels of inflation. For the best guess at inflationary expectations, take a look at trailing CPI, since most investors and forecasters simply extrapolate from current conditions when predicting the future. Trailing CPI is currently at 40 year lows of 1.0% per year.
2) GDP Growth. A strong economy correlates with rising interest rates because it causes strong demand for credit, i.e., demand for borrowed money. Rising demand obviously pushes up the price (i.e., the interest rate). Also, a strong economy tends to create inflationary bottlenecks (see point 1), which leads the Fed to tighten monetary policy (see point 3).
3) The Fed. The Fed is supposed to lean against the prevailing economic winds to prevent the economy from “overheating”, that is, from experiencing such rapid growth that inflationary bottlenecks develop and price increases get out of hand. The Fed only has direct control over short term interest rates, but long term rates tend to follow short term rates with a lag, so Fed policy is a key determinant of longer term rates (like the 10 Year) as well.
If fundamentals told the whole story, in theory one would be able to predict the direction of interest rates if one could accurately predict the direction of inflation, GDP growth and the Fed’s policies. Alas, it is not that “simple.” For now we must consider the so-called “technical” factors that also have a huge role in explaining movements in interest rates. These technicals refer to forces that move markets in the short run, when big players (such as hedge funds or the larger money managers) place huge (often leveraged) bets on the direction of interest rates. The bets may or may not have anything to do with the fundamentals. Sometimes (like recently) they fly in the face of the fundamentals. More about this later.
One of the most important technical factors that can cause sudden swings in the bond market is its junior sister, the stock market. While correlations between stocks and bonds can swing all over the map in the short run, it is generally clear that when the stock market sells off in a panic, investors flock indiscriminately to the safety of Treasuries, pushing prices up and yields down. This was seen during the crash of 1987, the mini-crash of 1989, during the Long Term Capital crisis of 1998, after September 11, etc. It is important to remember that the opposite is also usually true as well, that when the stock market gaps up on panic buying, bonds generally sell off.
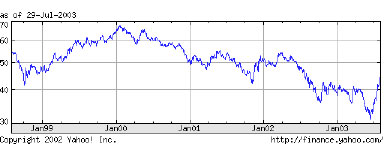
10 Y TSY YLD NDX (WCB:^TNX) - Trade: N/A

So let’s look at the recent (five year) history of yields in the 10 Year Treasury market. The chart above shows that until the Fall of last year, yields on the 10 Year had never fallen below 4.0% during this period. Indeed, one would have to go back a quarter century or more to find 10 Year yields with a 3 handle. The two occasions where yields got even close to 4.0% were associated with panics in the stock market: the hedge fund crisis of the Fall of 1998 and the market collapse associated with the September 11 terrorist attacks in 2001. Both of these dips in yield were therefore technically driven, short-lived, and quickly reversed as yields backed up to 5.0% or higher.
In 2002 rates did fall steadily, and for good fundamental reasons. Inflation was falling to forty year lows of 1% per year, GDP growth was stubbornly anemic, and the Fed was aggressively cutting rates. All three of the most important fundamental factors, therefore, were working in favor of lower yields. In October of 2002, rates on the 10 Year actually dipped below 4.0%, hitting a low of approximately 3.70%. This dip, however, was another case of a technically driven market, as investors fled from the stock market on fears concerning the impending war with Iraq. Rates quickly bounced back above 4.0%, before testing the October lows again in March, for the same reason.
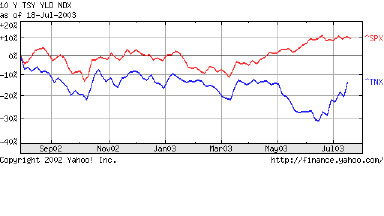
10 Y TSY YLD NDX (WCB:^TNX) - Trade: N/A
Compare: ^TNX vs. S&P Nasdaq Dow

The chart above shows this relationship between stocks and bonds. In both October 2002 and March 2003 the declines in bond yields were associated with drops of 10% or more in the stock market (here defined as the S&P 500).
In April of 2003 it became apparent that the conflict in Iraq was going to result in a quick and relatively low casualty U.S. victory, while Saddam Hussein’s weapons of mass destruction were not in evidence. Stocks began to move upwards as a result, while bond yields rose back above the crucial 4.0% level. Economists and politicians were virtually unanimous in predicting a strong second half of the year, and stocks rose even higher. Clearly, with an improving economic outlook and the removal of the most important technical support for the bond market (namely, falling stock prices), yields should have been moving higher. So what happened in May? Interest rates instead went into a swoon, dropping steadily before hitting the 3.07% low point in mid-June, while stocks continued their advance.
Obviously this move had nothing to do with fundamentals. The fundamental outlook for the economy was improving. So what caused interest rates to plummet? Aggressive moves into Treasuries by hedge funds and other speculators on the basis of jawboning by the Fed on the subject of deflation. The process started on May 6, when the FOMC concluded its meeting with comments regarding the worrisomely low level of inflation (Huh? I thought the Fed, as an inflation fighter, welcomed low inflation?). Things gathered steam in June, as Fed spokesmen from Mr. Greenspan on down all gave speeches on the dangers of deflation, and the readiness of the Fed to take unusual steps, including buying of longer maturity Treasuries, to keep rates low and the risk of deflation at bay. At this point, what self respecting hedge fund could resist buying Treasuries? Not for the fundamental reason that they actually expected deflation, but because the Fed had more or less promised to take them out of their positions! The race was on, and the speculators kept on diving into Treasuries, pushing yields lower.
At this point, particularly after yields crashed through the old lows around the 3.70% level, another even larger technical factor kicked in. The mortgage industry, from small mortgage bankers to the mammoth Government Sponsored Enterprises (“GSE’s”) Fannie Mae and Freddie Mac were watching their assets melt away as homeowners took advantage of record low yields to refinance their mortgages in record numbers. With every mortgage in America now refinanceable, the entire multi-Trillion dollar industry was forced to buy Treasuries as a hedge against continued falling rates, thereby creating a self-fulfilling prophecy that only exaggerated the amplitude of the decline in interest rates. This mortgage activity always kicks in when rates are at extreme levels, by the way, and is a good indicator (along with increased levels of volatility) of a market top or bottom.
As the chart above clearly shows, by mid June stock prices and bond yields had now widely diverged. From a fundamental perspective, the outlooks implicit in the two markets could not possibly both be correct (deflation is most definitely not good for stocks), and something would have to give. The speculative loser turned out to be the bond market. Rates started moving back up in late June, but the real coup de grace occurred in mid July, when Chairman Greenspan (in testimony before Congress) effectively took the option of Fed buying of long term Treasuries off the table, while simultaneously giving a most rosy forecast for economic growth in the remainder of 2003 and 2004. Bonds suffered their worst crushing in many years, and 10 Year yields rose as high as 4.40%, well above the 4.0% level they had reached in May before the silliness began. Just as speculative excesses had driven yields to unrealistically low levels in June, so the unwinding of the hedge fund trades and reversal of the buying by mortgage bankers quickly drove rates higher than a fundamental evaluation would suggest was appropriate. What does fundamental analysis suggest as an appropriate level? Well, when one considers that historically investors have required at least a 3% real return on longer maturity bonds, and that trailing inflation is currently at a 40 year low of 1% (and more likely to rise than fall from here), yields much below 4.0% look hard to justify. This view receives further support from the fact that, with the exception of last month’s frenzy, yields on the 10 Year had never in recent history pierced the floor of 3.70%. Even this level was only reached during panic buying of Treasuries due to stock market sell-offs.
What then can we conclude from Professor Bondo’s summary of the fixed income market? The most important conclusion is that neither fundamental nor technical analysis alone can explain market movements. The deliberate evaluation of long term inflationary expectations by sober institutional investors does indeed play a role, to be sure. But in the short run, such things as hedge funds keying off of Federal Reserve jawboning, or flows out of equities, or mortgage bankers hedging their pipeline can jointly or severally swamp the effects of the fundamentals. At such times, extreme valuations (both overbought and oversold) are created. But unless one understands what underlying actions by market participants are driving the price movements, taking advantage of the extreme valuations will be well nigh impossible.
AND BELOW….
A NOTE FROM THE TECHNICIAN
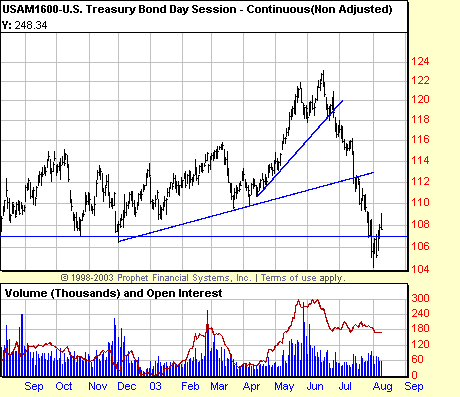
We have been saying for some time that a fortune is waiting to be made short bonds. Two signal points are clearly identified on this chart. The third is the horizontal line waiting to happen. Adroit traders will be waiting for this pullback to exhaust itself and then will get short for a long-lasting trend trade. We wouldn’t still be short at this point, but would be watching the reaction here and looking to increase our position when it turns.

To download a pdf version of this letter: bondomercado.pdf


